A tale of two halves Table of Contents: Overview Key Learnings Suggested Action Core Metrics TL Spot & Contract Curve Analysis 360 | Checking the Record Rate Forecast Port to Porch Market Forecast Current Overview The bottom of the freight market is officially behind us. Spot rates are slowly on the rise with contract rates […]
The bottom of the freight market is officially behind us. Spot rates are slowly on the rise with contract rates following suit, many retailers have succeeded in clearing out old inventories and inflation levels have declined to 4.6% in June 2023 after reaching a high of 9.1% a year ago.
According to our proprietary analysis, the Beon Band, spot rates in the truckload freight sector hit the bottom of their slump cycle in May 2023 and remained relatively stable through June 2023 with only moderate increases. As we entered July 2023, the holiday weekend acted as a catalyst for rates to spike 10%, however the normal seasonality of a July lull had rates retreating down to levels we witnessed in June 2023.
Currently in early August 2023, the sentiment is that spot rates will continue their journey upward with contract rates following suit.
TL Market Fundamentals
The ultimate question is, at what velocity and magnitude will spot rates increase?
Back to the fundamentals, we know there are two leading indicators that can give us the answer – supply and demand.
Supply: We know for certain the surplus capacity (owner operators and some mid-size carriers) that entered the market over the past three years is exiting due to operating costs, but how quickly will excess capacity be forced to exit?
Demand: The consumer has proved to be resilient this year. However, we must consider the record high consumer credit levels, resumption of student loan repayment and persistently high inflation when examining what future demand will look like. Will demand pick up in Q4 2023? How much more can consumers spend?
There is no crystal ball, but there are strong data points that inform our prediction. Let’s dive in.
Interest Rates
Roughly 70% of the US GDP is based on consumer spending. The Federal Reserve Bank has increased interest rates each quarter since March 2022, when we saw an increase from 0.25% to 0.5%, with the latest increase being 5.25% to 5.50% reported on July 26, 2023.
Consumer Debt
As interest rates increase, consumer debt also increases. According to the Federal Reserve Bank of New York, total household debt rose 0.9% to $17.05 trillion in Q1 2023. Mortgage balances climbed by $121 billion and stood at $12.04 trillion at the end of March 2023. Auto loan and student loan balances also increased to $1.56 trillion and $1.60 trillion, respectively, but credit card balances were flat at $986 billion.
Retail Sales & Inventory
Retail sales remained positive during the first half of the year and significantly contributed to loosening bloated retail inventories. Although, the shedding of inventory came at a price for many retailers running promotions to unload inventory that negatively impacted profits. Our research and analysis conclude that we’re in the last round of inventory destocking for retailers, indicating that replenishment for peak season is around the corner. Trucking firms also noted lower retail inventories.
“We’ve been on record that 2023 was going to be a tale of two halves, with the first half of the year trending down and the back half of the year trending up. We still stand by that. Q3 has been a bit slow out of the gates but we expect to see a better peak season than 2022.”
Supply and demand drive the freight market. Consumers are still spending, but it is significantly less than during the pandemic. Carriers are exiting the market, although it is taking time to unwind from the surge of new entrants from prior years.
As a result of decreased demand when compared to 2021 and 2022, and an oversaturated carrier market, spot rates are currently at -9.9% YoY in Q3 2023 and are on their journey upward. To succeed in this environment, it is crucial to have visibility into internal and external datasets and conduct proper planning for when the market approaches inflationary territory.
Many carriers reached their operating cost floor and have left the market as a result, however given the sheer volume of carriers that entered the market in 2021 through 2022, it’s taking a while for enough capacity to attrit and align with the decreased demand when compared to that same period.
While spot rates are slowly on the rise and contract rates are following suit, we haven’t experienced a large capacity dislocation event to accelerate rate increases since the CVSA International Road Check and Memorial Day. Without any unexpected events, such as a hurricane, we believe that normal seasonality and capacity attrition will drive the freight market through Q3 2023 and into Q4 2023. This means that the freight market will be watching how peak season preparation and national holidays impact freight volume and rates.
Suggested Action
Here are our top 4 tips for shippers when preparing for Q4 2023 and 2024:
Find the right balance of spot and contract freight. There is still time if you act now.
Last quarter we encouraged shippers to move as much volume as possible from the spot market to the contractual market over the next three months. There is still time to do this before contractual rates become inflationary YoY. Start with the 75% of your network that operates consistently or higher volume markets where you can find competitive contractual rates. With the freight that you do choose to leave on the spot market, make sure you don’t get caught flat-footed as rates increase.
Continue to get comfortable with uncertainty. Be aware and stay agile in the 2024 planning process.
We know the freight market operates in a cycle. Rates go up and rates go down. Carriers enter. Carriers exit. Demand increases. Demand decreases. However, there are periods when the fear of uncertainty, or prospective change, weighs heavily on supply and demand. We will feel this through the end of the year and into 2024 with inflation, fuel costs, increased payroll costs, and the Presidential Election Cycle Theory on the minds of shippers, consumers and carriers alike. While we are certain the freight cycle will turn, the speed at which it turns is always the question. As time passes, the reaction to these stressors and uncertainties will be a strong indicator of the velocity and magnitude we’ll see.
“You have an opportunity to assess your current RFP strategy but need to move fast and get ahead of the new cycle. Remember contract lags spot by about 2-3 quarters. Those releasing RFPs in early 2024 may be at risk of higher contract rates due to spot rates being on the rise. The longer you wait, the more those increasing spot rates will impact contract pricing with carriers and 3PLs.“
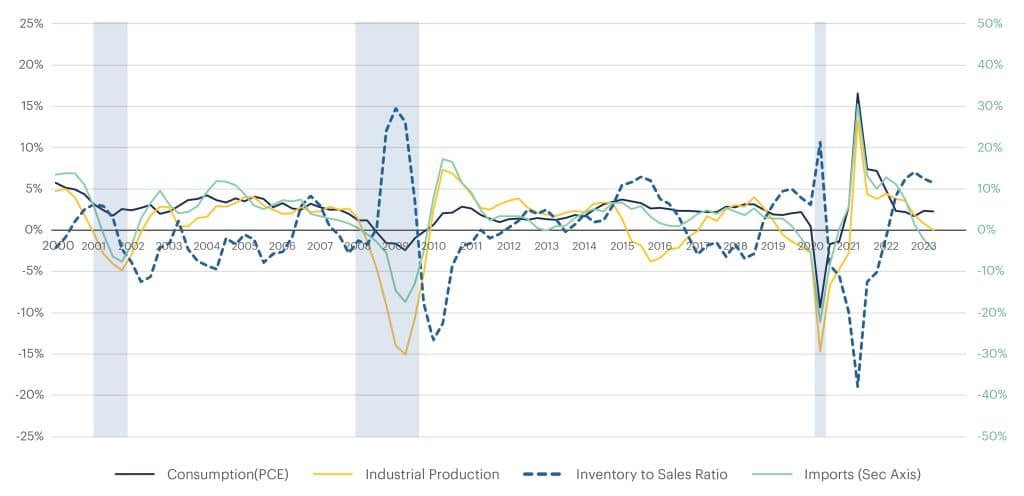
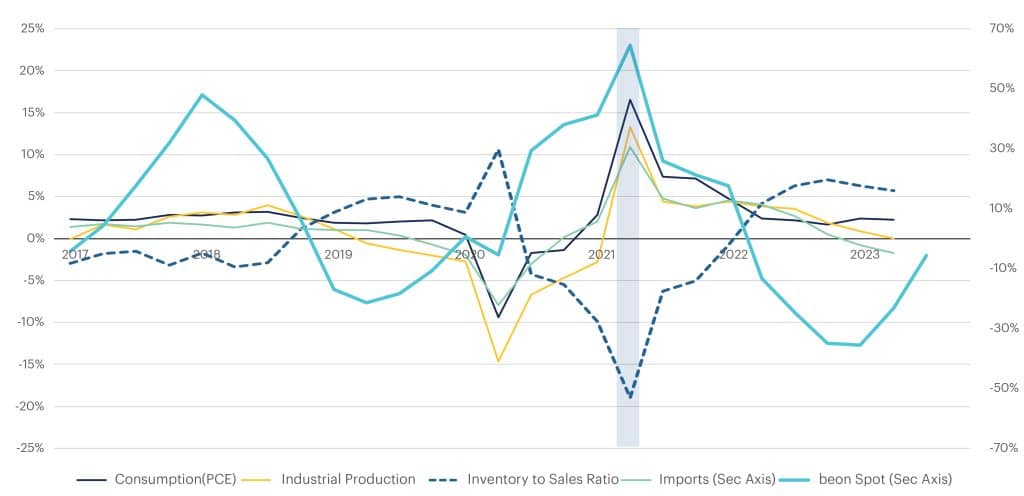
The Key Economic Indicators : The Cause (% YoY Change by Quarter)
Source: Bureau of Economic Analysis (BEA), Federal Reserve, Census Bureau, Bureau of Labor Statistics
Consumption (PCE) for Q2 2023 reported at +2.3% YoY, holding steady after +2.4% reported in Q1 2023.
We are back to pre-2020 PCE range and against all other odds PCE continues to be resilient. This consumer resiliency reflects an optimistic side of the economy while inflation continues to be above the Fed’s target rate.
Non-durable goods reported +0.48% YoY consumption after a consecutive four quarters of negative readings.
Consumption for durable goods continues to move upwards from +2.6% in Q1 2023 to +3.4% in Q2 2023 YoY.
Services saw a slight reduction from +3.3% in Q1 2023 to +2.6% in Q2 2023 primarily due to continued inflation in the services sector.
Industrial Production (IP) fell further down to +0.02% in Q2 2023 against +0.9% in Q1 2023.
With sales reported to decline in the wholesale sector and inventory piling up, manufacturers continue to apply brakes on production.
If production continues to decline, it will fall below the X-axis.
In past years, an IP reading below the X-axis has coincided with an economic recession.
Imports continue to decline for the sixth consecutive quarter since Q1 2022 and went down further to -4.8% YoY.
The continued decline is after a record high level of imports in 2021 and first half of 2022, but it’s still higher than the pre-pandemic period.
U.S containerized imports in June 2023 were in tally with May 2023 but down 16.1% compared to June 2022, according to Descartes. We are optimistic that imports will come back for peak season.
Inventory to Sales ratio for May 2023 held steady at 1.40.
The % YoY change in this ratio for Q2 2023 is currently at +5.7%, which is lower than +6.3% reported in Q1 2023.
If consumption improves sales, and hence manufacturing, we may see demand picking up over the next few months and taking this ratio further down.
Freight Demand Metrics
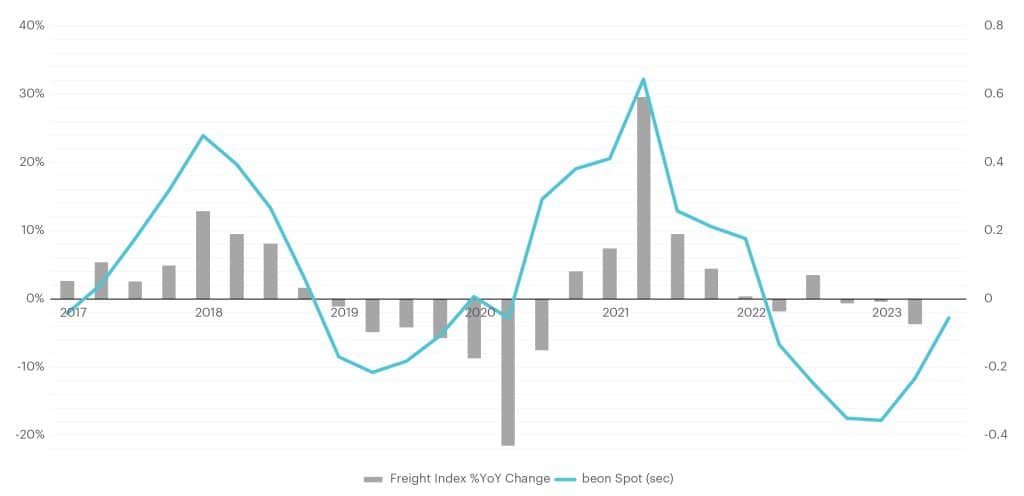
Cass Freight Index : %YoY Change by Quarter
Source: Cass Freight Index
Freight volumes represented by CASS Freight Index show the continued decline in demand for the third consecutive quarter.
With June 2023 readings, Q2 2023 reported at -3.7% YoY, which is also 5% lower than Q1 2023.
The index for June 2023 and Q2 2023 is at its lowest in the past 11 quarters, indicating freight demand is at the lowest point in over two years.
Freight Supply Metrics
New Authorities & Revocations (FMCSA)
Source: Federal Motor Carrier Safety Administration (FMCSA)
Carrier revocations of operating authority continue to outpace new grants of authority for the past three quarters, indicating the continued exit of capacity in an oversupplied market.
While net revocations in June 2023 came in lower than May 2023’s figure, the reading is still higher than the new carrier authorities for June 2022.
This is the seventh net reduction in capacity over the last eight months since October 2022 (with a slight exception in April 2022).
Class 8 truck net orders in Q2 2023 reported negative % YoY growth for the second consecutive quarter.
In August 2023, FTR reported that truck order lead time fell to 5.8 months, which is the lowest it’s been in over two years.
Declining truck order lead time is a strong indicator of capacity exiting the market faster than capacity is willing to enter.
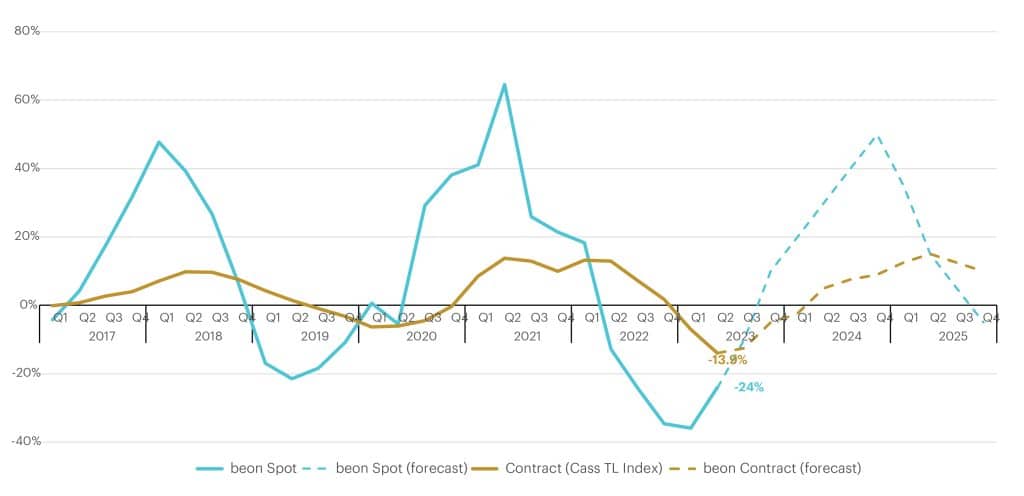
TL Spot & Contract Curve (% YoY Change by Quarter)
What is the Beon Band?
The Beon™ Band rolls up YoY quarterly averages of this data to create trend lines. This band is the outcome of the relationship between freight supply and freight demand, with freight demand being driven by the macroeconomic demand indicators. When we overlay the Beon™ Band with the demand curve in a single chart, we can see demand’s influence on the to-the-truck costs.
Source: Beon Band – Transportation Insight Holdings
Analysis 360 | Checking the Record
What we got right in the previous outlook.
We project that the Beon Band will now move upwards towards the equilibrium from here with Q2 2023 around -22.5% and turn inflationary crossing the abscissa in the second half of Q4 2023.
From our analysis we were right on the mark with the YoY change in Q2 2023 Spot Rates ending at –24%. We are still projecting the Band to cross the abscissa in Q4 2023.
With net revocations of carrier authority running above 7,000 per month since October, we’re seeing capacity exit. We believe this trend will continue throughout this quarter and into the next.
Net revocations have held right around the 7,000 per month mark since we last reported on them. We expect this trend to continue throughout Q3 2023 and into Q4 2023 as well.
Where we were off the mark and why.
We expect the contract cycle to go further deflationary in Q2 and Q3 2023. It will likely start heading towards equilibrium in Q4 2023 and should cross the X-axis in Q2 2024. Contract cycle lags spot cycle by 2-3 quarters.
The deeper than expected drop in the spot rates in Q1 2023 caused a deeper than expected drop in the contractual market in Q2 2023. As a result, we have revised our projection for the YoY change in contractual rates to have already hit bottom. While rates will remain negative versus their yearly comparisons, we expect contractual rates to stay at the bottom in Q3 2023.
Rate Forecast
Spot: Rates are on the climb upward towards the abscissa. With an oversupplied market in a declining demand economy, capacity continues to exit the freight market. We expect Q3 2023 to average out to a -10% YoY change in spot rates when compared to 2022. Consumer demand will pick back up driven by peak season inventory stocking. As we enter Q4 2023, we will see YoY inflationary rates and predict that Q4 2023 will average a +10% YoY change in rates. 2024 will be a massive year for changes in spot rates. Our proprietary analysis forecasts spot rates in Q1 2024 will average out to +20% YoY.
Contract: Rates bottomed out in Q2 2023 at -13.9% YoY. We expect that Q3 2023 contract rates will continue to stay at the bottom around -12.5% YoY and start heading upwards with Q4 2023 rates projected at -5% YoY. We expect contract rates will enter inflationary territory in the back half of Q1 2024 and the average for the quarter will be -2.5% YoY. Contract curve lags the spot curve by approximately two quarters.
“Q1 2023 was confirmed as the trough of the deflationary cycle, with cost to the truck moving upward since DOT week in May. Shippers should take the opportunity to review their transportation and procurement strategy through the remainder of the year as we project that the inflationary leg of the cycle will loom over the entirety of 2024. Striking a balance between cost and service, versus chasing cheap rates, will benefit you in the long term as capacity gets tighter and spot rates become more attractive than the contractual rates for carriers.”
Beon Band vs Economic Demand Indicators: % YoY Change by Quarter
Source: Bureau of Economic Analysis (BEA), Federal Reserve, Census Bureau, Bureau of Labor Statistics, Beon Band – Transportation Insight Holdings
Beon Band vs Freight Demand (CASS Freight Index) : %YoY Change by Quarter
Source: Cass Freight Index, Beon Band – Transportation Insight Holdings
Port to Porch Market Forecast
Inventories, Imports, & Peak Season
The National Retail Federation (NRF) Port Tracker notes that the prospects for a recession in the second half of 2023 are dimming and imports should increase. It expects monthly YoY declines in imports to decrease over the coming months, with imports showing growth in November 2023, which would be the first such reading in 18 months.
We are optimistic about a stronger than forecasted peak season, given the clear signs of growing tightness in the market and resolved disruption at the ports.
MoM imports from Asia bottomed out in March 2023 at 1.08 million TEUs and steadily climbed to 1.42 million TEUs in June 2023.
FEU (Forty-Foot Equivalent Units) container spot rates from Asia to the West Coast jumped 70% since June 2023.
The strike at the US West Coast ports was alleviated in June 2023 when a tentative agreement between the union and the Pacific Maritime Association (PMA) was reached.
It is important to note, it will be several months before the contract is ratified by union members and even longer for volumes to return to those ports. Many shippers diverted volumes to East and Gulf Coast ports to avoid potential disruption.
Truckload
Truckload carriers are exiting the market; most notably smaller carriers. For reference:
In the first six months of 2022, over 47,000 drivers at carriers with less than five trucks, lost operating authority.
In the first six months of 2023, over 71,000 drivers at carriers with less than five trucks, were no longer operating.
This is a 51% jump in driver attrition, which is hardly surprising given the surge in capacity that entered during the COVID-era is no longer able to profit at current demand levels. On top of that, over the past two years, larger assets keep getting bigger as smaller players get smaller. For reference, FTR reported:
1-5 truck firms lost nearly 10% of their capacity between July 2022 to June 2023.
100+ truck firms experienced a 2.5% gain in available capacity.
Given market dynamics, this is not out of the norm and is what should be expected during a protracted market downturn. The larger carriers will try to take advantage of their expansion and strategically “park” surplus trucks and force the market to react. As rates begin to increase, drivers will be assigned to those seats and operate over the road. Eventually, we will see a dance between assets and their drivers, with some drivers opting to leave the asset and run as an owner-operator in favor of chasing higher rates in the spot market.
Less-Than-Truckload
Our analysis of Yellow’s exit from the industry suggests an immediate short-term impact on LTL pricing, but a low to moderate long-term impact.
Our analysis shows that there is a sufficient buffer in labor capacity and productivity across existing LTL providers in the current market. These providers can absorb the YRC volume, which represents roughly 10% of the total LTL market, leading us to believe there is insignificant impact to be expected long term.
Growth for the LTL freight market has been declining over the past 12 months due to oversupplied capacity in a declining demand economy. This disruption should help LTL growth rebound and move upwards again.
Parcel
UPS and the Teamsters reached a tentative agreement in July 2023 and Union members will vote on the agreement during August 2023. If ratified, it will mean higher costs for UPS and will result in another record-breaking rate increase for 2024. We anticipate 6.9% increases on transportation and double digit increases on many surcharges and fees. We anticipate other carriers will take advantage and follow suit with rate increases in 2024. UPS will begin fighting to win lost customers, but we expect them to be selective in this pursuit.
Demand surcharges are expected to be announced in Q3 2023 with peak season returning to its normal, pre-pandemic period of November – December. However, retailers are mitigating last mile delivery costs by encouraging “buy online, pick up in store,” or BOPIS. Retailers such as Target, Walmart and Amazon are expanding their own last mile delivery services and we expect the USPS to compete more aggressively for ecommerce customers by pushing their new Ground Advantage service.
Cross-Border
Geopolitical risks are driving nearshoring opportunities to Mexico. “If US manufacturing is to be less dependent on China, we think the path will be via Mexico,” says Morgan Stanley Research equity analyst Nikolaj Lippmann. According to the consulting firm, nearshoring has the potential to boost growth of Mexican manufacturing exports to the US, from $455 billion today to an estimated $609 billion in the next five years.
Take the time to assess your network and uncover opportunities. Act on the quick wins.
This is a great time to conduct a supply chain analysis to understand your carrier base and your distribution network. Now is not the time to sit on your hands and ride the market without having a detailed understanding of your data and the health of your supply chain. Are you working with providers that are financially stable? Do you have the right mix of 3PLs, brokers, and assets? Are there opportunities to optimize and protect yourself from volatility in 2024? Uncover what you can do now to build resilience for the year ahead, and plan for the changes that will protect your supply chain long term.
Find the right balance of spot and contract freight. There is still time if you act now.
Last quarter we encouraged shippers to move as much volume as possible from the spot market to the contractual market over the next three months. There is still time to do this before contractual rates become inflationary YoY. Start with the 75% of your network that operates consistently or higher volume markets where you can find competitive contractual rates. With the freight that you do choose to leave on the spot market, make sure you don’t get caught flat-footed as rates increase.
Continue to get comfortable with uncertainty. Be aware and stay agile in the 2024 planning process.
We know the freight market operates in a cycle. Rates go up and rates go down. Carriers enter. Carriers exit. Demand increases. Demand decreases. However, there are periods when the fear of uncertainty, or prospective change, weighs heavily on supply and demand. We will feel this through the end of the year and into 2024 with inflation, fuel costs, increased payroll costs, and the Presidential Election Cycle Theory on the minds of shippers, consumers and carriers alike. While we are certain the freight cycle will turn, the speed at which it turns is always the question. As time passes, the reaction to these stressors and uncertainties will be a strong indicator of the velocity and magnitude we’ll see.
Transportation Insight (TI) is a leading provider of supply chain and logistics solutions, helping North American manufacturers, retailers and distributors optimize transportation, reduce costs and improve operational efficiency for more than 25 years. Offering expertise in managed transportation, freight audit and payment, parcel optimization and data-driven analytics, TI partners with clients to streamline supply chains, enhance visibility and drive strategic growth.
On this article:
Sign up for the TI newsletter to get exclusive updates.
Start improving your supply chain with the latest logistics news and insights.
By submitting this form you agree to our data processing policy.


 Source: Bureau of Economic Analysis (BEA), Federal Reserve, Census Bureau, Bureau of Labor Statistics
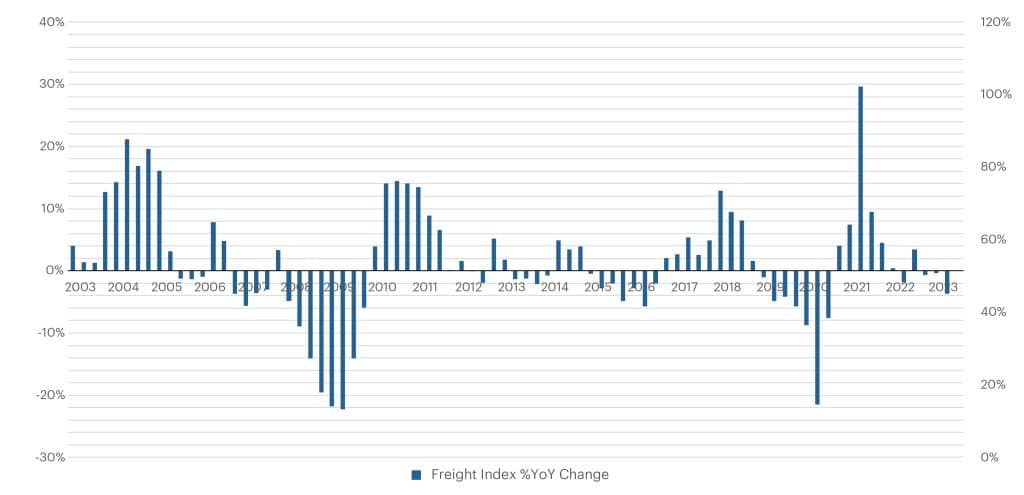 Source: Cass Freight Index
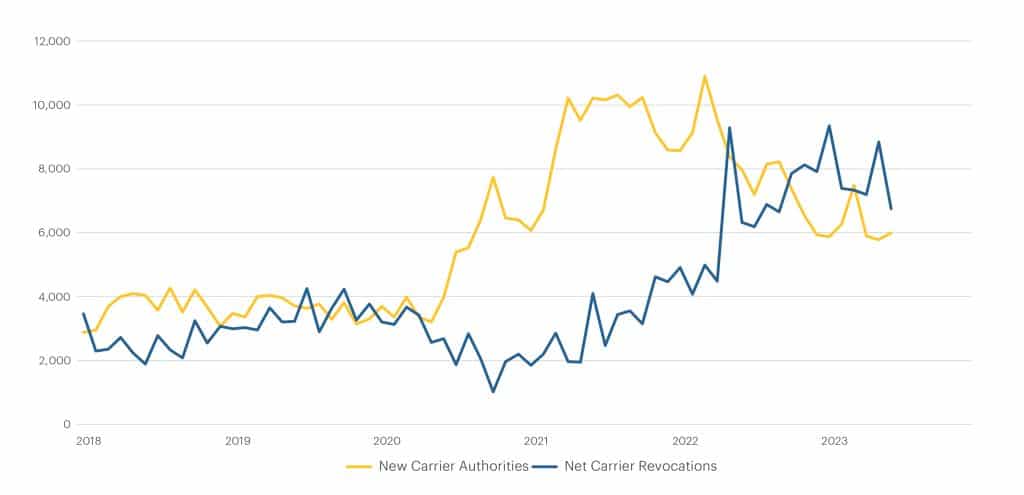


On this article:
Sign up for the TI newsletter to get exclusive updates.