- Solutions
Back to Knowledge Center
3 Freight Cost Challenges Better Data Visibility Can Solve
Discover how greater visibility helps shippers uncover cost discrepancies, strengthen data integrity and make smarter freight management decisions.
Nov 11, 2025 — 5 Min Read

For most shippers, freight cost control begins with strong planning and rate negotiation. Yet even the best-laid plans can unravel when the invoice arrives and it’s higher than expected. Those unexplained differences between what was booked and what was billed often become invisible margin drains that are subtle, recurring and difficult to diagnose.
Freight cost visibility has evolved from a reporting exercise into a core business discipline. It helps organizations identify when costs diverge, why cost estimates are inaccurate and how to prevent repeat occurrences. With the right intelligence, cost visibility becomes more than data. It empowers companies with the control needed to achieve desired profit margins and deliver the service customers require to keep them coming back for more.
Here are three common challenges that better cost visibility helps solve, along with real-world scenarios that show how small insights can lead to significant savings.
Challenge 1: Unexplained Freight Cost Deltas
Every organization experiences differences between booked and invoiced freight costs, but few can quickly identify what caused the delta. Weight reclassifications, unforeseen additional carrier delivery services, or routing adjustments can each inflate costs by small percentages that add up across thousands of shipments.
Scenario:
A national equipment distributor booked truckload shipments across several regional carriers. When invoiced amounts began exceeding booked totals by 3–5%, the finance team initially blamed carrier rate increases. However, analysis revealed that 70% of the variance came from carrier service charges tied to delivery delays and incomplete consignee data.
By comparing booked and invoiced cost data, the operations team discovered a pattern of repeated detention fees across a specific grouping of customer locations. Correcting routing instructions and improving communication with carriers along with customer sites reduced the average cost delta per load by 4.6% and prevented similar charges from recurring.
The Takeaway:
Visibility into cost deltas allows shippers to trace every variance back to its root cause. Over time, those insights strengthen both budgeting and carrier accountability.
Challenge 2: Inconsistent Data and Compliance
Data gaps between a transportation management system (TMS) and invoicing platforms create financial blind spots. If the systems don’t match, entire portions of freight activity can fall outside of visibility and control.
Scenario:
A global manufacturer using multiple TMS instances noticed that monthly invoice totals exceeded expected spend by more than 8%. A compliance review found that 14% of shipments weren’t properly routed in the TMS due to non-compliant operators at a particular shipping site.
By tracking invoice-to-TMS match rates by shipping location and carrier, the company isolated non-compliant party and quantified more than $1.2 million in non-optimized freight spend. Once addressed, the company was able to boost their performance to freight cost plan to over 98% and hit their desired profit margins.
The Takeaway:
Data integrity is the foundation of cost control. Monitoring program compliance and match performance ensures you have no operational blind spots and leads you to hit monthly plan targets.
Challenge 3: Fragmented Understanding of Freight Performance
When teams rely on disconnected views of transportation data, performance issues remain hidden. Finance teams track costs by budget category, Operations monitors carrier KPIs and Procurement negotiates rates, but none share a unified understanding of what’s driving total cost.
Scenario:
A large consumer goods company managed both inbound and outbound freight across multiple facilities and distribution centers. Each group analyzed its own carrier performance data, but overall transportation costs continued to rise despite stable contract rates.
Once cost variance data and TMS compliance metrics were combined, the visibility gap became clear. Certain facilities were consistently shipping under-utilized truckloads due to mismatched routing guides and poor modal weight breaks, while others were hit with repeated reweigh charges. Connecting cost and compliance data across the network revealed optimization opportunities that lowered total freight cost by 6.8% and improved load utilization across modes.
The Takeaway:
When visibility connects operational and financial perspectives, organizations can shift from investigating problems to improving performance.
Turning Freight Cost Visibility into Action
Freight cost visibility should do more than display data. It should reveal relationships, patterns and causes that drive better decisions. Achieving that clarity requires cost visibility tools that translate complex freight activity into actionable insights that everyone — from logistics operations to CFOs — can leverage for positive change.
Transportation Insight’s Beon Insight platform delivers this level of intelligence through:
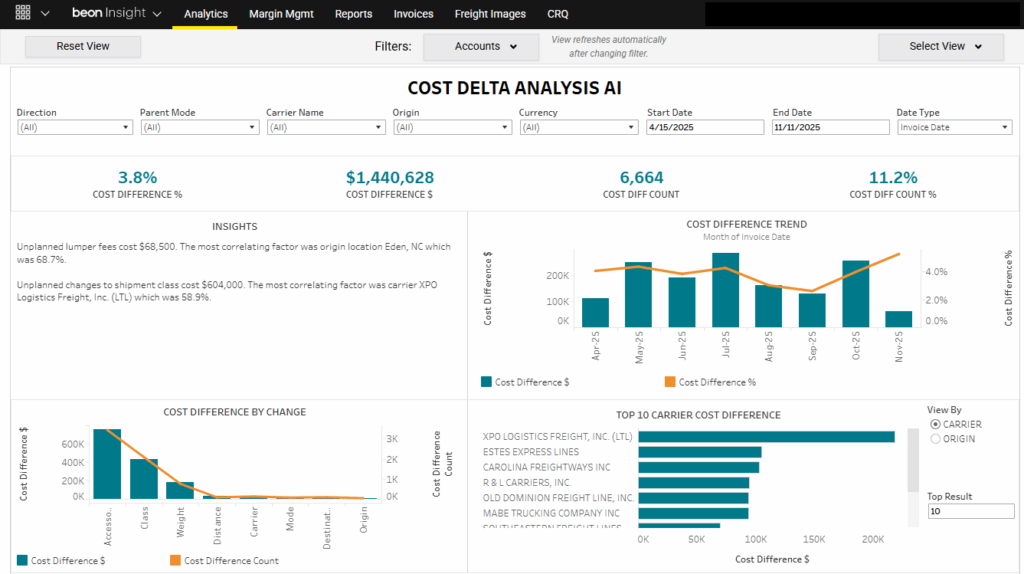
- Freight Cost Delta Analysis AI Dashboard – Detects and explains shipping cost deltas with AI-driven insight, helping teams understand why freight costs change and where to focus improvement efforts to achieve cost and profit targets.
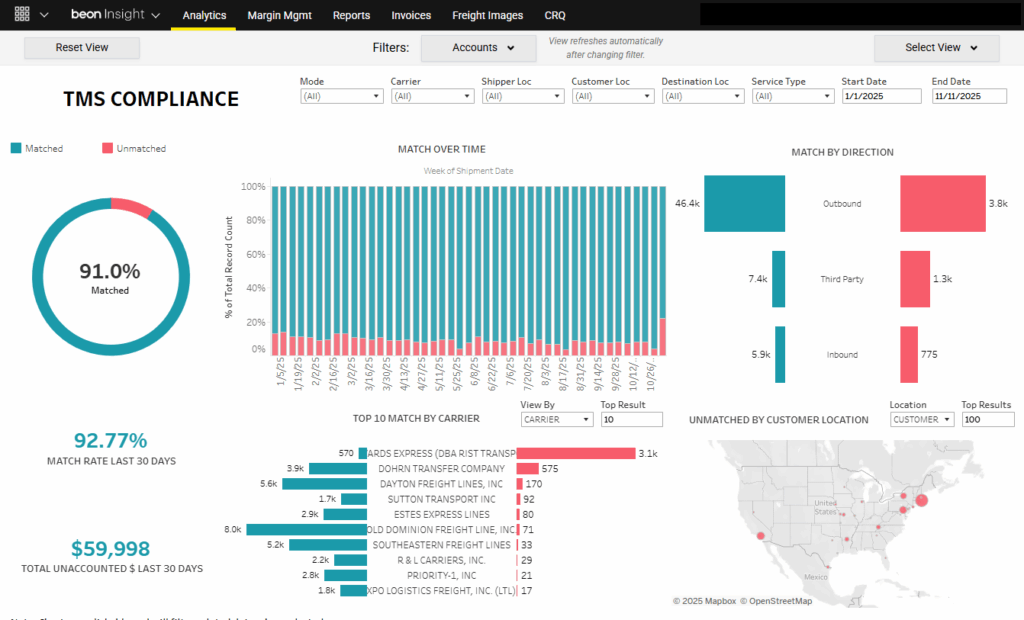
- TMS Compliance Dashboard – Monitors invoice-to-TMS match rates to identify data gaps, quantify unmanaged spend and strengthen financial transparency.
Together, these capabilities transform shipment visibility into action, giving business leaders the intelligence to manage transportation costs with precision and confidence.
Want to see how Beon Insight can help you uncover the real drivers behind freight cost discrepancies and strengthen visibility across your supply chain? Let’s talk.
About Author:
More Blogs


On this article:
Sign up for the TI newsletter to get exclusive updates.