Change is coming in the transportation industry. Rising spot rates bring increased volatility. Are you ready to navigate the coming year with a sound strategy? Our Q1 2024 Transportation Outlook informs you about key events that will influence the timing and magnitude of the volatility.
We will cover:
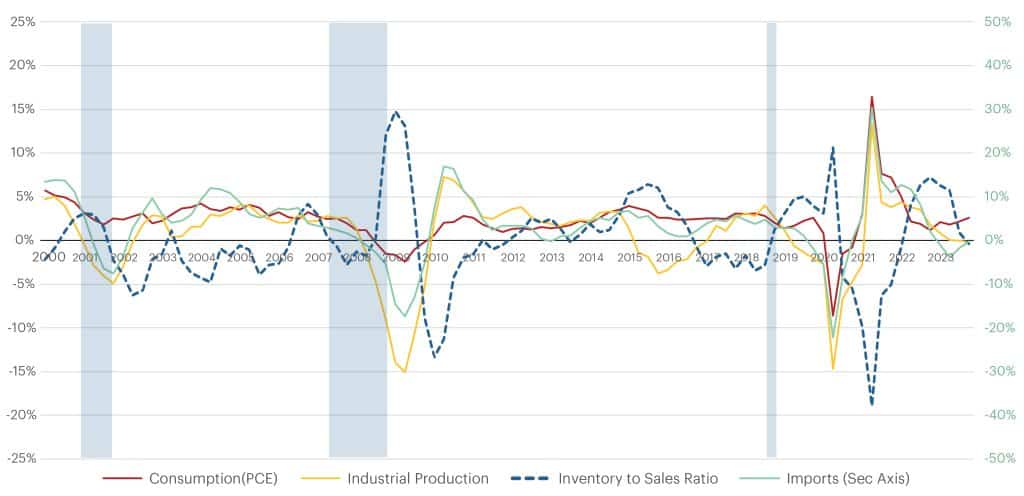
- How are macro-economic indicators such as imports, Personal Consumption Expenditures (PCE), the inventory-to-sales ratio and industrial production influencing freight demand?
- How much capacity remains from the pandemic and when will there be a balance of supply and demand?
- What is the current state of Truckload Spot and Contract Rates and where are we predicting rates to go over 2024?
- What can be expected for other transportation modes like Drayage, Less-Than-Truckload (LTL) and Parcel?
We know not everyone has time to read the entire outlook, so if you’re one of those who just want to get pointed to exactly what you’re looking for click below to jump to a certain section:
- Key Events and What to Watch: Inflation, Interest Rates and The Fed, Consumer Behavior, Container Traffic Related to Lunar New Year and State of Parcel
- Core Macro-Economic Metrics: PCE, Industrial Production, Inventory to Sales and Imports
- Freight Demand Metrics: Cass Freight Index
- Freight Supply Metrics: Grants and Revocations of Operating Authority
- Truckload Spot and Contract Rate Forecasts: Where is the market going?
- Port to Porch Forecast: Drayage, Less-Than-Truckload and Parcel Insights
- Leadership Talking Points: How to communicate these findings to your leadership teams within your organization.
In The News and What to Watch
Inflation & Interest Rates
- The US Federal Reserve’s preferred measure of inflation stayed at +2.6% year-over-year (YoY) and has been trending lower.
- The Core Price Index (CPI) rose by 0.2% in December and was +2.9% YoY. This is the lowest rate of inflation since February 2021.
- Prices for durable goods dropped by 2.3% YoY. Disinflation has been primarily driven by falling prices in furnishing, durable household equipment, recreational goods and vehicles.
- Inflation for services also fell below 4% YoY for the first time since June 2021.
- Interest rates remain high and make financing large purchases difficult for many. Rates will decline somewhat in the coming year but will likely remain elevated.
- We also expect the YoY growth in housing prices to continue decreasing over the coming months.
The Fed’s Latest Update
- The Federal Reserve maintained the target range for the federal funds rate at 5.25% to 5.5% after the February meeting.
- While ruling out a rate cut in March, the Fed emphasized the need for greater confidence in sustained inflation movement before considering reductions.
- The FOMC’s statement hinted at future policy adjustments, with a focus on assessing incoming data and balancing economic growth with inflation control.
- Economists anticipate a “soft-landing” scenario, where the Fed can curb inflation without jeopardizing economic growth.
- The central bank’s continued attention to economic indicators reflects a cautious approach, maintaining its highest targeted range for the federal funds rate in almost 23 years.
Consumer Confidence and Purchasing Power
- One of the leading indicators of consumer spending is consumer confidence, or how the consumer feels about the current and future economic situation.
- January’s US Consumer Confidence report indicated that the consumer is the most confident it has been since December 2021, with a 6.8-point increase from December 2023. This positive reading marked the third straight monthly increase.
- Real Disposable Personal Income rose by 0.1% in December and was 3.7% higher YoY indicating an increase in purchasing power.
- Savings that went up in November fell back to 3.7% in December.
Student Loan Repayments
- In October 2023, Congress ended the student loan repayment pause that has been in effect since March 2020, which impacts roughly 25% of US consumers.
- There was concern that the resumption of student loan payments would curtail consumer spending. However, contrary to many analysts’ expectations, the consumer remained resilient.
- In a January 26 survey conducted by the University of Michigan, 60% of respondents who currently hold student loans claimed they would not spend less because of the repayment resumption.
- Of all consumers, including those who do not have student loans, only 8% of the population plans to spend less.
Lunar New Year, Suez and Panama Canal Effects on Imports
- Lunar New Year will run from February 10 to February 24. Lunar New Year’s effect on shipping includes heightened shipment volumes and increased rates leading up to the holiday, as well as extended wait times for containers during the holiday.
- Currently, in the Asia-US trade sector, ocean carriers are rushing to implement general rate increases (GRIs) before the Lunar New Year, proposing hikes ranging from $600 to $1,000 per forty-foot equivalent unit (FEU), which will be in effect from February 1 to February 15.
- Carriers also implemented GRIs earlier this month with the East Coast spot rate increasing from $4,050/FEU to $6,166/FEU and the West Coast spot rate increasing from $2,800/FEU to $4,100/FEU, according to Platts/JOC.
- Carriers are also applying various surcharges like peak-season surcharges, war-risk surcharges and Panama Canal surcharges. The effectiveness and stickiness of these increases is uncertain.
Parcel: Money Back Guarantees, Demand Surcharges and GRIs
- UPS announced in their Q4 2023 earnings call in January, that their US Domestic average daily volume declined by 7.4% compared to the prior year.
- Air to Ground shifts: UPS’s total air daily volume was down 15% compared with the prior year as shippers shift volume out of the air onto the ground. FedEx announced its Express unit will lose half of its business with the United States Postal Service (USPS) when their existing contract expires. Both announcements follow the trend of shippers moving more volume from air to ground.
- Demand Surcharges: Both FedEx and UPS announced in January they will implement demand surcharges and fees ranging from $2.00 up to $40.00 per package.
- General Rate Increases: USPS announced price changes in January, with USPS Ground Advantage increasing by 5.4%, Priority Mail increasing by 5.7% and Priority Mail Express increasing by 5.9%.
- Money Back Guarantees: UPS and FedEx both announced they would reinstate money-back guarantees on 2 Day Air AM service.
Core Macro-Economic Metrics
The freight industry is slowly returning to pre-Covid levels after years of turmoil brought on by massive macroeconomic developments. This stabilization is attributed to the resilient consumer, a measured recovery in manufacturing, an ongoing inventory depletion triggering potential restocking and positive trends in imports, particularly in containerized shipments.
While the next cycle is upon us and we will eventually see a shift in pricing power away from shippers, these factors cautiously suggest the freight industry is on track to return to its normal cycles, instead of the massive peak and valley experienced the past 3 years.
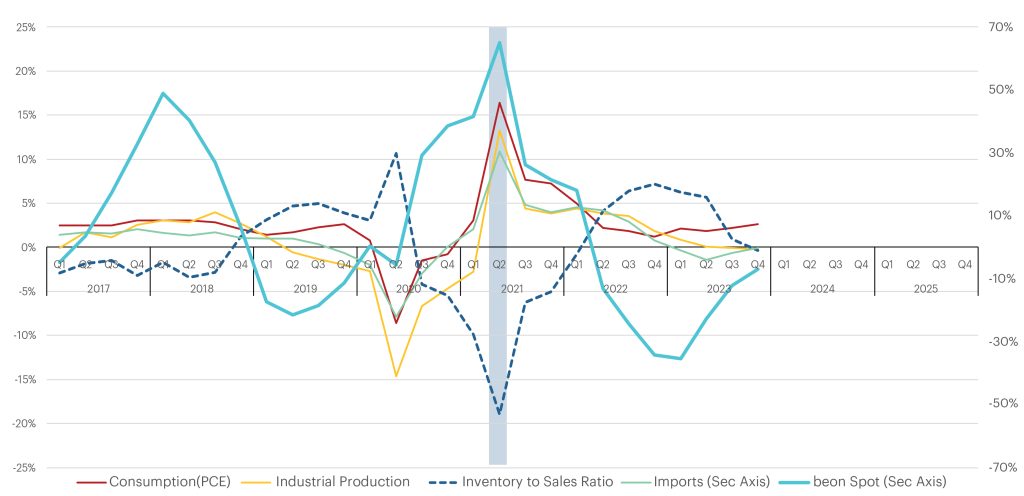
The Key Economic Indicators: The Cause (% YoY Change by Quarter)
Source: Bureau of Economic Analysis (BEA), Federal Reserve, Census Bureau, Bureau of Labor Statistics
More Info:
Real Personal Consumption Expenditure (PCE)
- PCE increased by +2.6% YoY in Q4 driven by both durable and non-durable goods indicating strong consumer sentiment.
- Consumption of durable goods increased by 6.1% YoY while non-durable goods were up by 2.2% YoY.
- Unlike the previous quarters where the spending was driven by gasoline and drugs, spending in Q4 was mostly driven by freight-generating sectors.
Industrial Production (IP)
- IP for Q4 finally settled at -0.2% YoY which marks the first deflationary quarterly readings since Q1 2021.
- Manufacturing Output, on the other hand, improved from -0.8% YoY last quarter to -0.5% YoY in Q4 coming out of automotive strikes.
- The US manufacturing sector continued to contract, as per ISM PMI report, but at a slightly slower rate in December as compared to November.
- The PMI for December came out 47.4% against 46.7% in November 2023.
- Companies are still managing outputs appropriately as order softness continues.
Inventory to Sales Ratio
- Inventory to Sales Ratio for November came to 1.37, which is the same as October.
- On a YoY basis, the ratio went down by 0.6% which indicates that the inventories continue to deplete.
- Sales went up by 1.0% YoY largely contributed by the retail sector in November.
- At the same time, the retail inventories continue to stay high at +5.3% while wholesale inventories dropped by -3% YoY.
- If the inventories continue to deplete triggering the restocking and the consumer base stays resilient, we should see increased freight activities soon.
Imports
- Imports went up 0.5% in Q4 and were at -0.2% YoY against -1.7% in Q3.
- Container imports growth turned positive after five quarters of decline and was at +6.6% YoY in Q4.
- Significant increase in TEUs volume across the West Coast after eight quarters of volume decline. Port of Long Beach/Port of LA saw more than 25% YoY growth in TEU volume.
Freight Demand Metrics
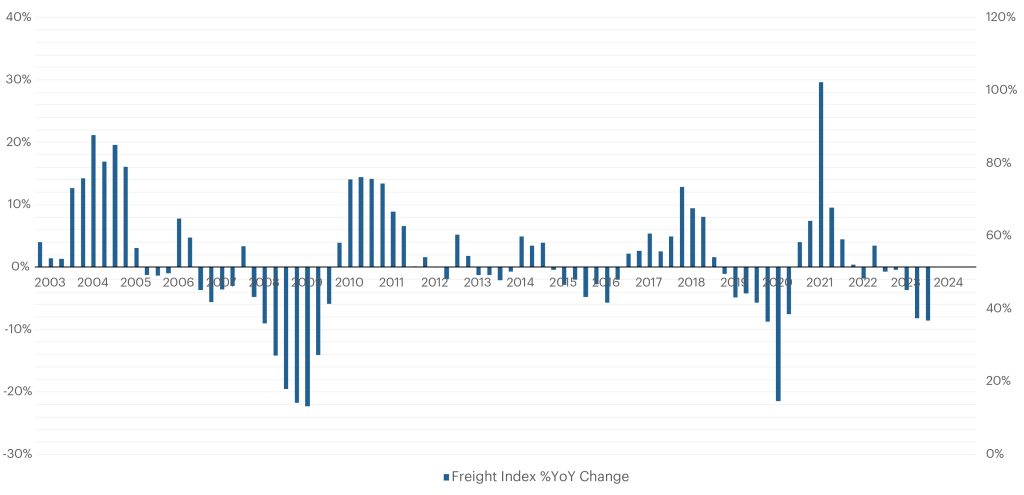
Freight demand is currently at the lowest level in the past 13 quarters.
However, it’s not the lowest it ever has been such as during periods during or following recessions. This is partially due to resilient consumers continuing to spend on goods even with the headwind of inflation.
Cass Freight Index: %YoY Change by Quarter
Source: Cass Freight Index
More info:
- Freight volumes represented by CASS Freight Index show the continued decline in demand for the fifth consecutive quarter.
- With December 2023 readings, Q4 2023 reported at -8.5% YoY, which is also 0.6% lower than Q3 2023.
- The index for December 2023 and Q4 2023 is at its lowest in the past 13 quarters, indicating freight demand is at the lowest point in over three years.
Freight Supply Metrics
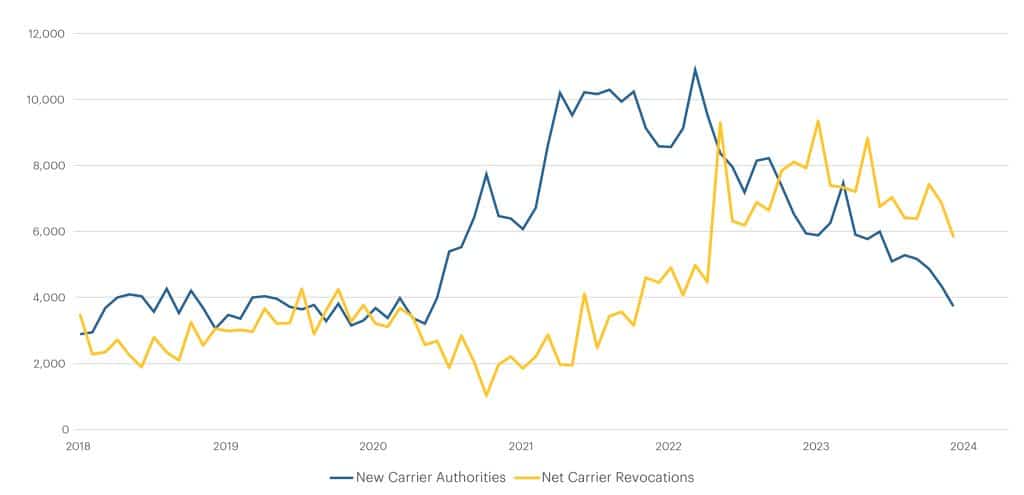
For five consecutive quarters, capacity reduction continues in this oversupplied capacity market. The last quarter of 2023 had the lowest-ever recorded net capacity addition of -7,204 revocations or carriers leaving the market.
For context as to just how much capacity entered the market from 2020 through 2021, when inflationary rates persisted for six quarters, an average of 25,269 new trucking companies were granted operating authority each quarter, surpassing the pre-pandemic average by 2.5 times.
Conversely, in the past six quarters with declining shipping costs, approximately 21,749 trucking companies had revoked their operating authority every three months, more than double the pre-pandemic average.
Comparing the above rates (entry vs. exit in their respective cycles), there is a strong indication that the industry is approaching the necessary supply correction to re-enter an inflationary market. Additionally, Class 8 Truck Orders and Net Orders reported negative figures in Q4 2023 on a YoY basis for the first time since the first quarter of 2022, highlighting a decline in truck order lead time and suggesting that capacity is exiting the market faster than it is entering.
New Authorities & Revocations (FMCSA)
Source: Federal Motor Carrier Safety Administration (FMCSA)
More Info:
- Carrier revocations or exits continue to outpace new grants of authority for the fifth consecutive quarter, confirming the continued exit of capacity in an oversupplied market.
- During the peak of the last freight cycle, in which we experienced 6 quarters of inflationary rates, 25,269 new trucking companies were granted operating authority each quarter. This is 2.5 times the quarterly average pre-pandemic.
- On the flip side, during the last six quarters when shipping costs have been dropping, around 21,749 trucking companies have had their permission revoked every three months. Again, this is more than double the pre-pandemic average.
- Since all the revocations are not reported to FMCSA, taking these numbers into account, we can deduce that we are nearing the supply correction needed to re-renter the inflationary market.
- Retail Sales for Class 8 TR Orders went negative (on a YoY basis) in Q4 2023 for the first time since Q1 2022.
- Net Orders also reported a negative 4.3% YoY in Q4.
- Declining truck order lead time is a strong indicator of capacity exiting the market faster than capacity is willing to enter.
“The good news is we’ve passed the bottom and are moving ahead into the next cycle. While analysis is important, if all you do is analyze data endlessly or wait for all the information, you’ll miss your chance to act. We learned from past cycles; where we’ve made mistakes and where we were right on the money. Reflecting on 2017 to 2018, what actions did you take? After that freight cycle, we saw routing guides fall apart, rate volatility, and rising costs for shippers. No two cycles are the same; however, we believe this next cycle will have similarities to ’17 and ’18. Keep that in mind as you are planning for this year and for the long run.“

TL Spot & Contract Curve (% YoY Change by Quarter)
What is the Beon Band?
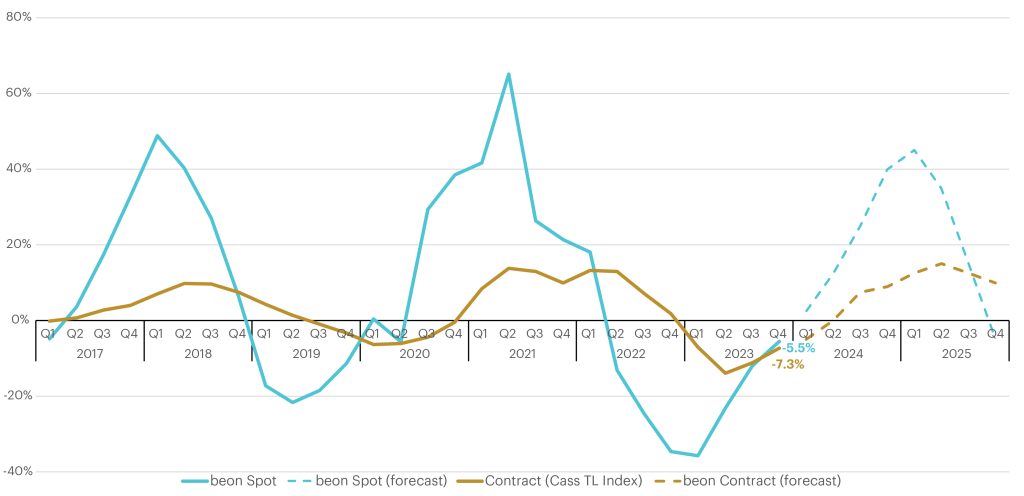
The Beon™ Band rolls up YoY quarterly averages of spot and contract freight data to create projections for future freight cycles. This band is the outcome of the relationship between freight supply and freight demand, with freight demand being driven by the macroeconomic demand indicators. When we overlay the Beon™ Band with the demand curve in a single chart, we can see demand’s influence on the to-the-truck costs.
TL Spot & Contract Cost Curve: %YoY Change by Quarter
Source: Beon Band – Transportation Insight Holdings
Beon Band vs Economic Demand Indicators: % YoY Change by Quarter
When the Beon Band is overlayed with the macroeconomic indicators of freight demand, we can begin to understand how some of these factors are impacting freight rates and thereby forecast where we see the market going over the next couple of quarters.
Rate Forecast
Spot: Rates are climbing upward toward YoY inflationary. Capacity continues to exit the oversupplied freight market, which has seen declining demand over the past six quarters. We expect the market to eventually turn inflationary in Q1 2024, with a projected YoY increase of +2.5%. This suggests that in Q1 2024 truckload spot rates will surpass Q1 2023 truckload spot rates. Consumer demand is expected to rebound in the second half of the year. Moving into Q2 2024, we anticipate a faster YoY increase in inflationary rates averaging 10% to 15%.
Contract: After bottoming out in Q2 2023, with rates 13.9% lower than Q2 2022, rates have been gradually rising. The fourth quarter of 2023 reported a decrease of 7.3% YoY. We anticipate contract rates to gradually increase to -5.0% YoY in Q1 and fall within the range of –2.5% to 0% in Q2. Our projection indicates that the curve will turn inflationary on a YoY basis in Q3 2024. It is important to note that the contract curve typically lags the spot curve by approximately two quarters.

“Carrier revocations of operating authority have outpaced new grants for five consecutive quarters, resulting in the continued reduction in capacity. This indicates that the market is ready to enter an inflationary leg of the freight cycle in late Q1 and early Q2. Shippers should review their transportation and procurement strategy, if not already, to ensure they have the right balance between cost and service to minimize routing guide disruption when capacity gets tighter and spot rates become more attractive than the contractual rates for carriers.”
Port to Porch Market Forecast
Drayage
Navigating through the remainder of Q1 2024 and into Q2, the drayage transportation landscape is poised for notable shifts and challenges. Notably, from February 10 to 16, Chinese ports will be closed in observance of the Lunar New Year. Consequently, between February 13 and March 22, a significant reduction in US import volumes from Asia is anticipated, with a projected return to relative normalcy in the last week of March. We say relative normalcy as it is crucial to note that other global events are impacting ocean traffic.
The water level limitations in the Panama Canal pose constraints on the passage of large vessels connecting Gulf and East Coast ports to Asia. Simultaneously, challenges are exacerbated by issues in the Suez Canal. Furthermore, the impending contract negotiation of the International Longshoreman Association (ILA) in Q3 raises concerns about potential labor disruptions and strikes in Gulf and East Coast ports, compelling shippers to seek more stable alternatives. These dynamics suggest a shift in import volumes back to the West Coast, positioning it to reemerge as the majority shareholder of US imports in 2024.
In summary, the first half of 2024 is anticipated as a strategic period for shippers to align their strategies and transition their routes to the West Coast where possible, paving the way for a pivotal Q3/Q4. Indications strongly point toward a significant rebound in West Coast ports, particularly in Los Angeles and Long Beach and perhaps even the Pacific Northwest, presenting an opportunity that necessitates preparedness and strategic capitalization.
Less-Than-Truckload
Looking back at Q4 2023 data, LTL tonnage and shipment count continued to decline in Q4, but the rate of decline slowed down. Per American Trucking Associations (ATA), the LTL tonnage index for Q4 was 7.4% lower on a YoY basis against 9.8% in Q3. Revenue per shipment went up in Q4 by 1.4% but is still 1.1% on a YoY basis. There is a strong correlation between the Purchasing Managers’ Index (PMI) reported by ISM and LTL tonnages reported by ATA which also suggests continued industry volume declination but the rate of decline slowing down.
ISM PMI vs YoY Change in LTL Tonnage by Quarter
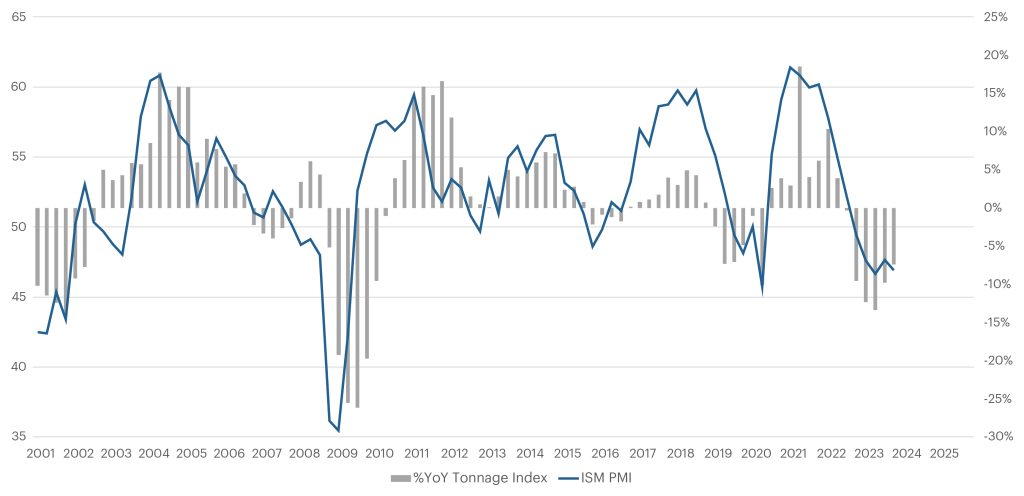
Looking into 2024, the first quarter is typically a softer market for LTL, which is proving to be true this year. Despite this, Yellow’s exit and further consolidation in the marketplace is counteracting the downward pressure on rates. As a result, the LTL market is currently balanced. While LTL carriers have capacity, they are targeting specific areas where there is a need within their networks rather than devaluing their services.
Transactional pricing is fully embraced by LTL carriers today but is much more strategic than in the past. When combined with API technology, carriers can precisely target the lanes where they need freight and adjust as often as needed.
LTL carriers are adopting a similar approach with contractual pricing. While incumbent carriers are still seeking increases, they are also exploring new business opportunities where they are not hauling today. As a result, customers can expect to see a mix of rate adjustments where some lanes may increase, while other lanes may decrease in their contractual rates.
Parcel
Despite the availability of capacity and carriers trying to regain volume, the actions and rate increases implemented by carriers do not align with that current state. It is noteworthy that even with volume significantly down, UPS and FedEx are still charging demand surcharges.
One of the most notable changes with national carriers surrounds the reinstatement of some of their money-back guarantees on certain service levels. The second most noteworthy change is around UPS’s Q4 2023 earnings call.
Based on this call, UPS mentions that they will shift focus back to SMB shippers. For context from 2020 to 2021, more than half of UPS’s shipper base was SMB shippers. UPS CEO Carol Tome mentioned at the end of 2023, around 28% of their shipper base was SMB shippers, and that would be a critical focus for 2024. With volume significantly down for not only UPS, but also FedEx and other regional carriers, parcel carriers are eager to regain volume back into their networks.
Based on our Parcel team’s feedback and some recent contract negotiations we have seen from customers, here is what you need to know and how we recommend you plan for 2024.
For SMB parcel shippers, now is the time to try and renegotiate any small parcel contract you have. Typically, SMB shippers are aggregating their spending with one carrier. But it may be worthwhile to look at other carriers out there, especially given that UPS has blatantly announced the focus on the SMB parcel shipper segment.
For large and enterprise parcel shippers, while your volume is down and while carriers (even regionals) are getting competitive with pricing, plan for future state and diversify. Be planning for the next three to five years. If you can lock in long-term pricing now and determine new carriers you can introduce, and how you can better equip your network and your infrastructure to support multiple carriers, then once demand does catch up – your parcel strategy will be more resilient.
Leadership Talking Points
We’ve now addressed key events to watch this quarter and this year, the current state of macro-economic demand indicators and freight supply indicators, our forecasted truckload spot and contract rates, as well as our port-to-porch forecast. Armed with that information, here’s how you can answer some of your executive team’s questions about what to expect in 2024:
- What is the current state of freight? The bottom of the market is behind us and we’re on the way into inflationary territory. As a result, there will be volatility in the form of rising spot rates and eventually rising contractual rates. In the last year and a half, rates were relatively consistent in terms of the spread between contract and spot. This year we will experience the shift when spot rates become more expensive than contract. This cross-over will bring volatility as carriers tend to gravitate toward freight that earns them more money per load.
- What does this mean for shippers? Slowly but surely, like any prior freight cycle, enough capacity will exit the industry for there to be a balance between supply and demand. As enough capacity attrition occurs, carriers begin to push back on shippers’ rates and we begin to see rate renegotiations. Many carriers will also likely renege on contractual freight and chase higher rates on the spot market, which will break apart routing guides and make shipping freight more costly.
- Transportation costs are still low, and we have no trouble finding trucks to move our freight. The freight market is like a faucet, not a light switch. Market transitions don’t happen instantly, but rather slowly, like the faucet slowly turning on. This is currently happening with stronger demand indicators and reduced capacity, signaling the shift into the next cycle. As carriers continue to exit the market, freight demand will rise, leading to significant changes. It’s important to note that during market changes, it’s not a sudden switch, but a gradual opening of the faucet.
- Okay, so what do I do now? Keeping in line with the suggestions we put out in the Q4 Outlook, you can take the following measures to protect yourself from the volatility that is to come in 2024.
- Ensure partner stability. Routinely assess partners’ financial and operational soundness to safeguard your supply chain – don’t just look at on-time performance and cost.
- Evaluate shipping lanes. Assess high-volume and irregular lanes for partner reliability, seek contract opportunities – especially with blind spot lanes in your network – and determine a network of asset and non-asset carriers. While consolidation is important, it’s crucial to strike a balance that avoids vulnerability and preserves flexibility.
- Optimize your network. Look at supplier and customer networks and determine ways to optimize. Implement quick wins based on the findings and incorporate the rest into your long-term strategy.
- Renegotiate parcel contracts. If you ship parcel, even if you aren’t in a renewal period, it may be a good time to reach out to other carriers. Some carriers are getting very competitive with rates even for SMB shippers, so look at regionals, nationals and the post office now.


