- Solutions
Back to Knowledge Center
Q4 2023 Transportation Outlook
A year ago, in Q4 2022, every indicator pointed to an economic climate unlike anything we’d ever experienced. We advised shipper and carrier partners to take the long view and develop a strategy that enabled them to fluidity navigate market shifts vs. exhaust resources by reacting to every jolt. Ultimately, easier said than done. We […]
Nov 6, 2023 — 16 Min Read

A year ago, in Q4 2022, every indicator pointed to an economic climate unlike anything we’d ever experienced. We advised shipper and carrier partners to take the long view and develop a strategy that enabled them to fluidity navigate market shifts vs. exhaust resources by reacting to every jolt.
Ultimately, easier said than done. We can all agree that 2023 has been one for the books and difficult to navigate. As we close out the year, a lot of questions remain:
What is top of mind for shippers:
- When is the next inflationary freight cycle?
- What should I be looking for/doing now to stay ahead of this?
- Do I have the right 2024 RFP strategy?
What is top of mind for carriers:
- Will there be enough freight demand in the first half of 2024 to stay in business?
- Will rates rise enough to cover inflated operating costs?
- Am I working with the right 3PLs and customers?
Before we dive into this quarter’s edition of our Transportation Outlook, inclusive of our macroeconomic update, spot and contract rate forecasts and top tips for shippers and carriers, it’s important to align on today’s freight market landscape.
Since Q3 2022, spot rates have been slowly on the rise year-over-year (YoY) with contract rates following suit. We know the market is turning…the ultimate question is, at what velocity and magnitude will we see rates increase in 2024? How will record-high interest rates impact this?
As it stands, we predict that YoY change in spot rates will be around –2.5% at the end of Q4 2023. Our forecast positions spot rates to turn YoY inflationary in Q1 2024 and continue their ascent through the entirety of the year. With contract generally lagging spot by two quarters, we predict contract rates to follow spot on the journey upward moving from –11.2% in Q3 2023 to –7.5% at the end of Q4 2023.
Truckload Market Fundamentals
Just as we did last quarter, let’s revisit the fundamentals and key indicators that inform this forecast.
Supply | Carriers have exited, but there is still an oversupply of capacity relative to demand.
Since the middle of 2022, there hasn’t been a month where Carrier Net Revocations of Operating Authority has been less than 6,000. However, given the sheer volume of new entrants that burst onto the trucking scene during the pandemic (over 120,000 operators), we still have months to go until we see a normalization of carriers compared to the relative demand levels.
Scroll to Freight Supply Metrics.
Demand | Consumers have been resilient but are spending more consciously headed into 2024.
The consumer has proved to be resilient this year, but with record high consumer credit levels, resumption of student loan repayment and persistently high inflation, the consumer is beginning to tighten the wallet and focus on essentials. This is a signal that consumers are concerned about the future of the economy and as a result, we may see a reduction in goods purchases and thereby a reduction in freight demand.
Scroll to Freight Demand Metrics
Consumer Sentiment | Buying behavior is shifting to essentials only for many households.
The October Consumer Sentiment report from the University of Michigan came in lower than expected at 63.8, down 6% from Sep. 2023. The Consumer Expectations Index, which depicts consumers expectations for the future, declined 6.5% from September into October, to 59.3.
Inflation | Inflation made a comeback in Q3 and remains well above the Fed’s stated target.
The Consumer Price Index (CPI) went up to 3.7% on YoY basis with energy prices being the primary driver. Personal Consumption Expenditure (PCE) index reported by BEA also shows inflation picking up for non-durable goods while durable goods further deflated in Q3. However, inflation remains high in the services sector with YoY growth close to 5% in Q3.
Interest Rates | Interest rates continue to rise each quarter and may rise again in Q4 2023.
Roughly 70% of the US GDP is based on consumer spending. The Federal Reserve Bank has increased interest rates each quarter since Mar. 2022, when we saw an increase from 0.25% to 0.5%, and the latest being 5.25% to 5.50% reported on July 26, 2023. There is talk of another potential rate hike in Dec. 2023 of 0.25%.
Consumer Debt | Household debt is steady, signaling saving vs. spending behavior.
As interest rates increase, consumer debt also increases. According to the Federal Reserve Bank of New York, total household debt rose from $16 billion, or 0.1%, to $17.06 trillion in Q2 2023. This is much less of an increase in overall debt levels when compared to the Q1 2023 increase of 0.9%, indicating that either consumers are running out of available credit or that they are being more cost-conscious when spending on credit cards.
“In this dynamic transportation market, we’re witnessing an acceleration of capacity changes, with both carriers and brokers exiting the industry. Costs are on a gradual, but persistent rise, and this will inevitably shape the upcoming RFP cycle. As we move into Q1/Q2 of 2024, we anticipate a restocking phase if consumers continue to buy with the sales inventory ratio continuing to turnover. In these challenging times ahead, the key is to collaborate with reliable, well-funded partners who are prepared to navigate the uncertainty.”

Peak Season | Expect a better peak than 2022, but still underwhelming vs. traditional levels.
Peak activity will be more favorable than last year for bigger players in the retail and ecommerce space. Smaller and mid-size players aren’t expected to see much of an influx. Consumers will continue spending on groceries, clothes and holiday gifts, but it’s more likely that is with the big box retailers.
Suggested Actions for Shippers
Here are our top 3 tips for shippers when preparing for Q4 2023 and 2024:
- Ensure your partners are performing, and financially stable. Protect your supply chain by ensuring your partners, vendors and carriers, are financially stable and operationally sound to mitigate risks. Make financial assessments a routine part of your selection process to safeguard your operation.
- Identify lane opportunities and blind spots. With continued uncertainty, assess your high-volume lanes and ensure you have partners that meet expectations on price, service and reliability. Next look at irregular, volatile lanes and identify contract opportunities within your current network, if any. Most shippers know 70%-80% of their network, but have blind spots with the remaining 20%-30% of providers. Resolving those blind spots will result in a trusted network of primary and incumbent providers, a mix of assets and non-assets, that enables you to perform more consistently when faced with market disruption. Consolidation is always at the forefront of every shipper’s mind, but consolidating too much can leave you vulnerable and remove your ability to remain flexible.
- Don’t be afraid to challenge your supply chain strategy. If you’re struggling to find cost savings opportunities, lean on experts to conduct a supply chain optimization assessment, which will dive deeper into your supplier and customer networks and determine what locations, days, times, etc. are going to maximize savings. Gaining awareness of the opportunities available to optimize your supply chain can bring an added perspective when operating. Take some of these findings and start implementing quick wins where possible and work the rest into your long-term strategy.
Suggested Actions for Carriers
Here are our top 3 tips for carriers when preparing for Q4 2023 and 2024:
- Establish a long- & short-term strategy for your operation and communicate it. Whether you have one truck or a fleet, evaluate your needs and preferences, then communicate them to your customers, partners and internal team. With key customers, ask long-term questions about their initiatives, operational pain points, capacity requirements and service expectations. In the short term, make sure you remain adaptable with valued customers by adjusting to market conditions, adopting technology and being proactive with communication that earns trust.
- Expand your network and nurture those relationships. Building and maintaining a network of shippers, brokers and other key industry contacts is essential. Focus on fostering clear lines of communication with both current and prospective partners. Networking is not just about making connections but nurturing them through regular updates and proactive engagement. Never put yourself in a position where you’re one relationship away from losing your main source of revenue.
- Hold yourself accountable for the investments you’re making. Whether you’re investing in technology, more drivers, improved compensation/benefits, better equipment or new facilities and service offerings, make sure you are holding yourself accountable for the desired outcomes/KPIs. Carriers should routinely assess the performance of their investments and understand how to turn them into more revenue. Make sure your drivers are meeting the service metrics demanded in today’s transportation market. Evaluate your assets and their ability to handle varying demand and market volatility. Stay focused on the right investments and right partners to position yourself for success long-term.
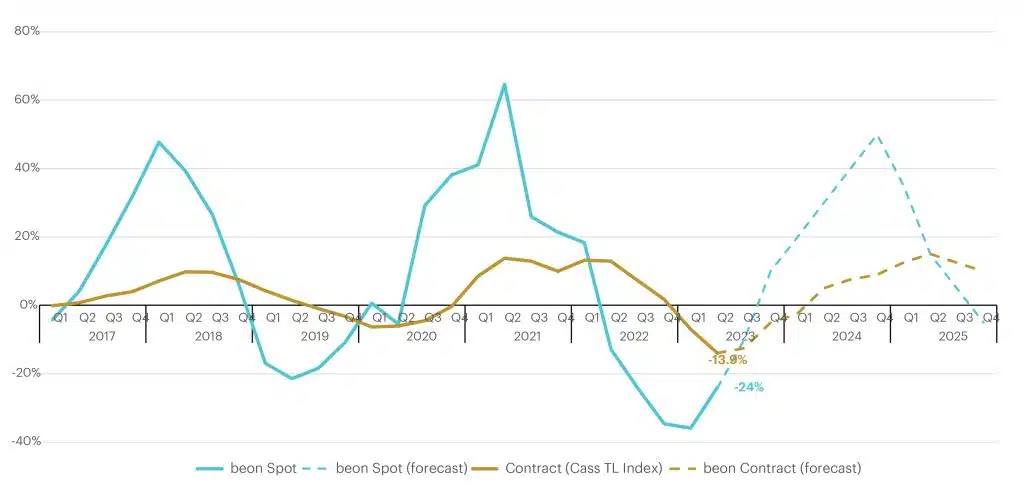
Truckload Spot & Contract Curve (% YoY Change by Quarter)
What is the Beon Band?
The Beon™ Band rolls up YoY quarterly averages of this data to create trend lines. This band is the outcome of the relationship between freight supply and freight demand, with freight demand being driven by the macroeconomic demand indicators. When we overlay the Beon™ Band with the demand curve in a single chart, we can see demand’s influence on the to-the-truck costs.
Truckload Spot & Contract Cost Curve: %YOY Change by Quarter
Source: Beon Band – Tranportation Insight Holdings
Analysis 360 | Checking the Record
What we got right in the previous outlook.
- Rates are on the climb upward towards the abscissa. With an oversupplied market in a declining demand economy, capacity continues to exit the freight market. We expect Q3 2023 to average out to a -10% YoY change in spot rates when compared to 2022.
- From our analysis we were nearly right on the mark with the YoY change in Q3 2023 spot rates ending at –12%.
- We expect that Q3 2023 contract rates will continue to stay at the bottom around -12.5% YoY and start heading upward with Q4 2023 rates projected at -5% YoY.
- We were close to the mark with our contractual rate forecast with YoY change in Q3 2023 contract rates ending at -11.2%.
Rate Forecast
With freight volume continuing to decline every quarter and capacity not exiting at the pace needed to correct an oversupplied market, we are revising our Q4 2023 and Q1 2024 forecast.
Spot: We expect Q4 2023 to stay deflationary at around –2.5% on a YoY basis. The Spot Band is expected to cross the abscissa in Q1 2024 (delayed by a quarter as opposed to our previous forecast) and turn inflationary at +5% YoY. Moving into Q2 2024, this number is expected to jump in the range +15% to +20% with produce initiating the capacity dislocation.
Contract: Contract rates hit bottom in Q2 2023 at 13.9% and inflected upward in Q3 2023. The Contract Band generally lags the Spot Band by two quarters, but this time the trough of the current deflationary cycle was only a quarter behind. We expect the Contract Band to continue its journey towards abscissa moving from –11.2% in Q3 2023 to –7.5% at the end of Q4 2023.
Scroll to Beon Band vs Economic Demand Indicators
Scroll to Beon Band vs Freight Demand (CASS Freight Index)
“Robust consumer spending and depleting inventory levels will likely trigger restock manufacturing activity and growth in freight demand in the coming months. This trigger, along with weak truck orders and carriers continuing to exit, will set the stage for an inflationary market in 2024 where spot rates will accelerate upwards and contract rates will follow suit. Shippers should take the opportunity to build resilience in their capacity networks by honoring, or adding, stable and reliable providers that hold strong on rates and service once tested with inflationary market conditions.”

Port to Porch Market Forecast
Drayage | The landscape for drayage and import conditions is undergoing a noticeable shift.
Retailers proactively restocked inventories earlier this year, which contributed to lower peak volume in the drayage market, and they currently express confidence in their inventory levels. With uncertainties linked to inflation and higher interest rates, consumers are slower to spend discretionary income and we see a steady decline in projected import volume for the remainder of 2023. As a result, container rates are declining, and ocean carriers have slowed down ships to reduce capacity with the reasoning being present market conditions. We have even seen some of the largest steamship lines make headcount reductions due to confidence levels in ocean demand for the rest of the year and into 2024.
Tip: While the market may potentially “return” in late 2025, the focus for now is to develop a strategy enabling you to navigate shifting import conditions and maintain competitiveness in pricing through the remainder of 2023 and into 2024.
Less-Than-Truckload | The LTL industry remained resilient through volatility this year, but many are contingency planning for further disruption.
With lower demand, the LTL freight market has been able to adapt and stay resilient amidst turbulence this year. Shippers have transitioned Yellow’s business to other providers over several months and most LTL carriers have absorbed the added volume well within their network. Next up, the National Motor Freight Classification changes occur in Dec. 2023, so be mindful of and have a strategy for any impacts to your business.
In preparation for 2024, shippers are assessing the vetting criteria for LTL partners with the events that occurred in 2023 top of mind.
Tip: Ensure that service and rates continue to be a focus but try to dive deeper into carriers’ operational strategies, financial state and cybersecurity practices like you would with your FTL providers. The more information that you get up front, and annually, the better.
Parcel | Carrier Diversification remains a priority, UPS and FedEx maintaining their annual General Rate Increases (GRI), but demand remains soft.
The biggest news in the parcel industry currently relates to 2024 General Rate Increases (GRI) and peak surcharges. The rate increases announced as of this publication are primarily across national options – UPS, FedEx, USPS, and DHL – but some regional players have also come to the table. UPS’s 2024 GRI Announcement. FedEx’s 2024 GRI Announcement, and DHL each came in with a 5.9% rate increase but shippers need to be detailed in their impact review as the carriers continue to focus on large, bulky freight and less than optimal delivery regions with substantial YoY increases. U.S. Postal Service (USPS) will also be implementing a 2% rate increase and some regional carriers have recently matched the nationals.
Postal final mile has gathered quite a bit of support recently, with many shippers leveraging USPS’s new service Ground Advantage for improved cost and an opportunity for similar service. To compete UPS rolled out UPS Ground Saver last month.
Tip: Ensure that as you analyze and report on the cost impact of annual price increases focus on accessorial and surcharge increases with zone adjustments.
Core Metrics
The Key Economic Indicators: The Cause (% YoY Change by Quarter)
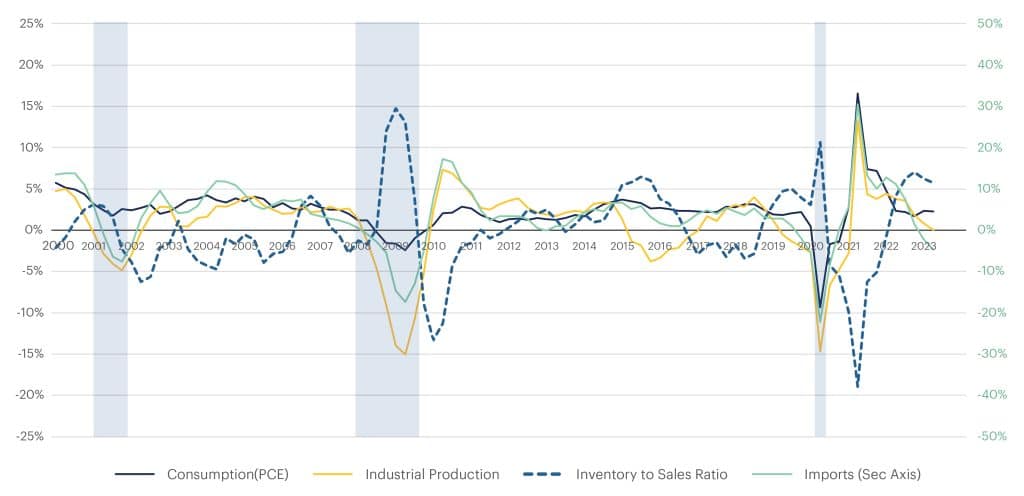
Source: Bureau of Economic Analysis (BEA), Federal Reserve, Census Bureau, Bureau of Labor Statistics
- Real Consumption (Personal Consumption Expenditure (PCE) went up by 1% in Q3 2023 on a seasonally adjusted basis. The robust consumer spending reflects an optimistic side of the economy while inflation continues to be above the Fed’s target rate.
- Real PCE went further up to +2.4% on YoY basis as compared to +1.8% in Q2 2023 with the goods sector showing significant signs of recovery.
- Consumption for durable goods went up from +3.2% in Q2 2023 to +4.9% in Q3 2023 YoY primarily coming from a 6.2% YoY increase in consumption for motor vehicle and parts.
- Non-durable goods reported +1.3% YoY consumption after staying low-to-negative for the past five quarters.
- Consumption in services was slightly up at 2.4% YoY despite continued high inflation in the services sector.
- After trending down for 10 quarters and nearly touching the X-axis, Industrial Production (IP) made a slight improvement in Q3 2023 and avoided falling below X-axis. In past years, an IP reading below the X-axis has coincided with an economic recession.
- Reading for Q3 2023 was reported at +0.1% YoY against 0.02% in Q2 2023.
- ISM Purchasing Manager’s Index (PMI) also reported 11 months of contraction in US Manufacturing Economy, but the index rose for the third month in a row in Sep. 2023 indicating that the rate of change has begun improving.
- Imports went up by 1.4% in Q3 2023 but stayed negative at –1.4% on YoY basis.
- The continued decline is after a record high level of imports in 2021 and first half of 2022, but it’s still higher than the pre-pandemic period.
- Container imports for Sep. 2023 came in at +0.5% YoY and turned positive YoY after 13 months.
- The Inventory to Sales Ratio further dropped to 1.37 in Aug. 2023 which is just 0.8% YoY.
- Sales turned positive YoY in Aug. 2023 after staying negative for five months.
- Inventory continues to drop from its peak at 20.6% YoY in Jun. 2022 to currently at +1% YoY in Aug. 2023.
- While the overall ratio is still 0.2%, the manufacturing ratio turned negative YoY in Aug. 2023.
All these metrics indicate that manufacturing activities are likely to pick up again, which is a positive signal for increased freight volume.
Freight Demand Metrics
Cass Freight Index: %YoY Change by Quarter
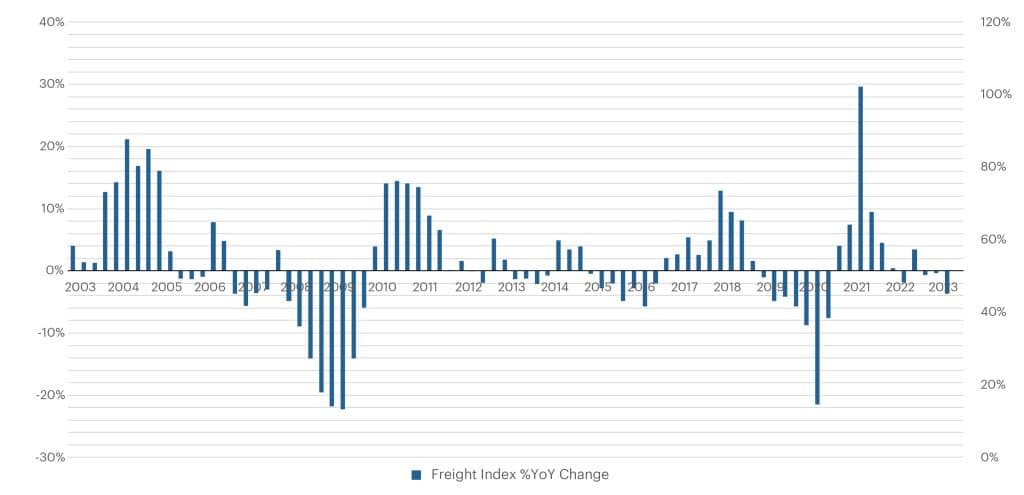 Source: Cass Freight Index
- Freight volumes represented by CASS Freight Index show the continued decline in demand for the fourth consecutive quarter.
- With Sep. 2023 readings, Q2 2023 reported at –8.1% YoY, which is also 1.6% lower than 2023.
- The index for August and Q3 2023 is at its lowest in the past quarter, indicating freight demand is at the lowest point in over two years.
Freight Supply Metrics
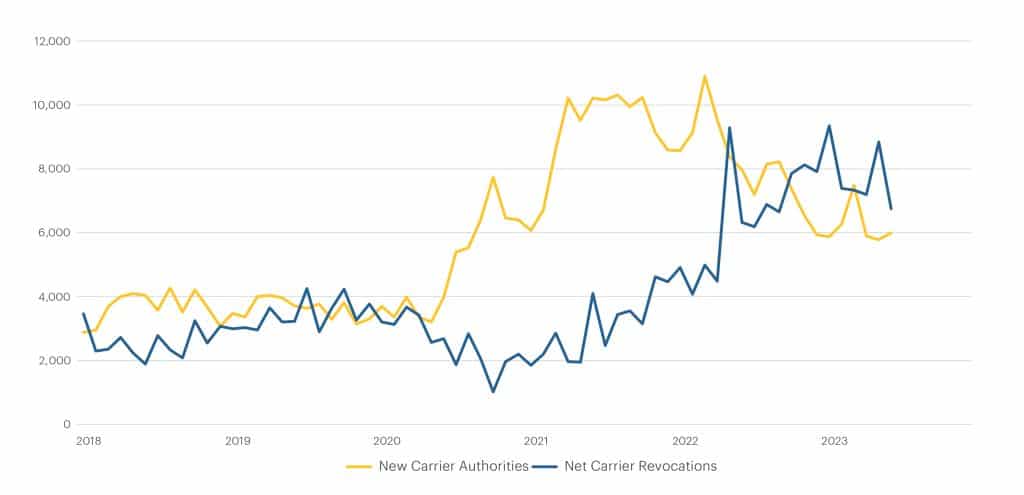
New Authorities & Revocations (FMCSA)
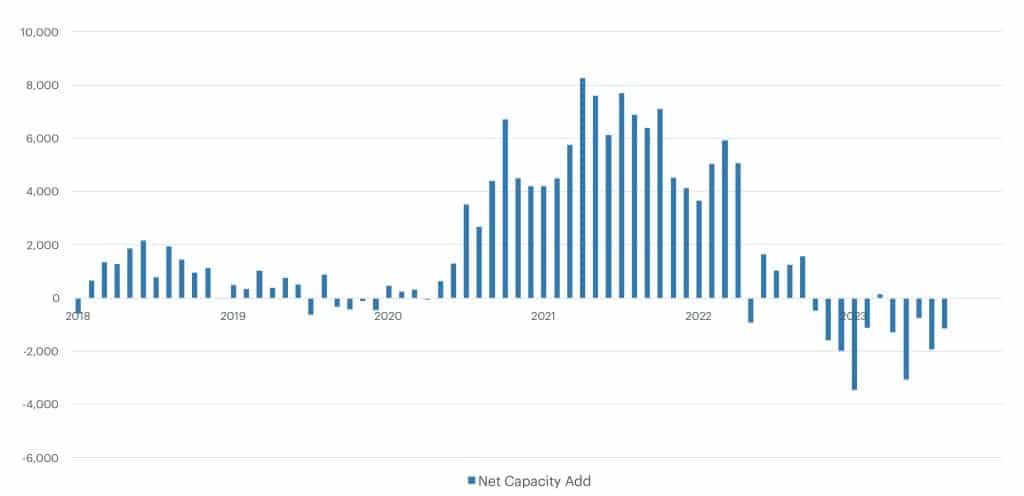
Net Capacity by Month (FMCSA)
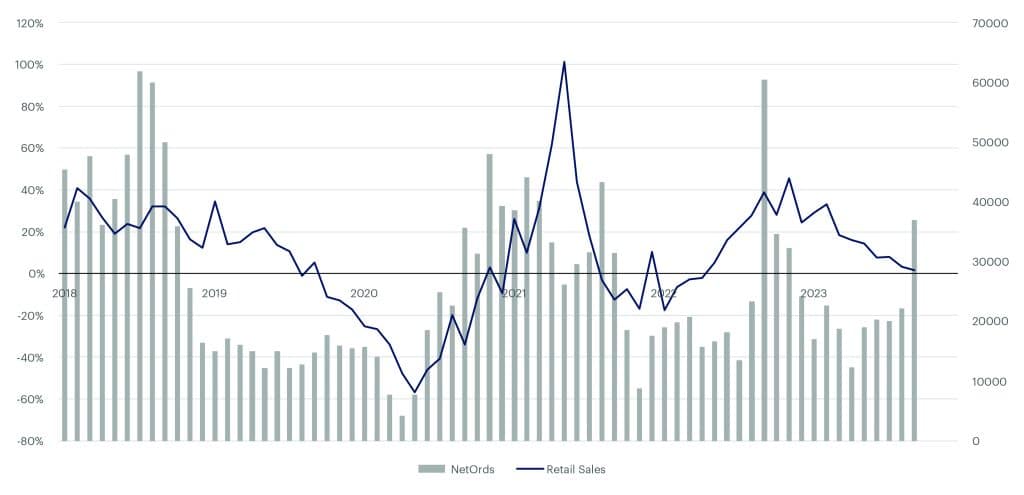
Class 8 Truck Orders by Month
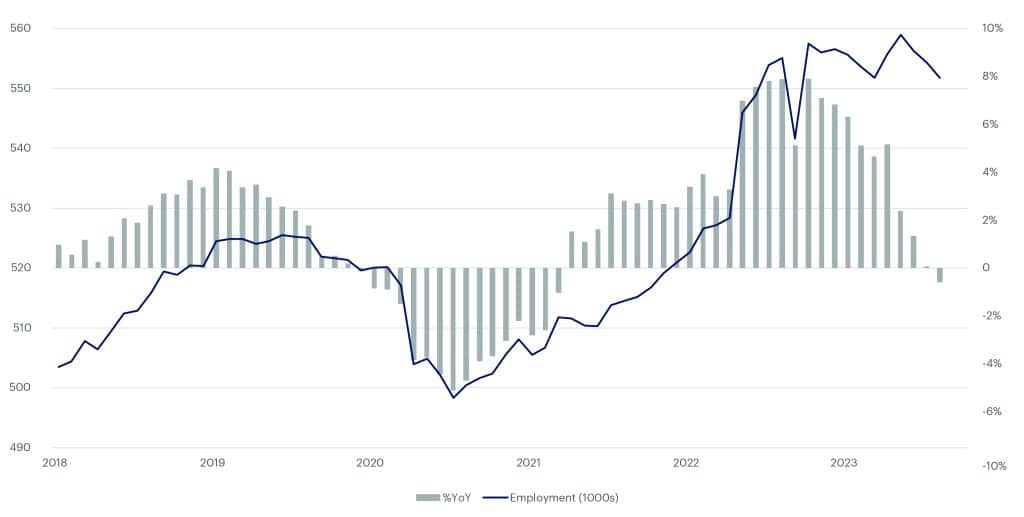
Long Distance Truckload Employment
- Carrier revocations of operating authority continue to outpace new grants of authority for the past four quarters, indicating the continued exit of capacity in an oversupplied market.
- FMCSA authorized 15,535 new trucking carriers in Q3 2023 which is 34.1% lower YoY and lowest post-pandemic.
- Net revocations for Q3 2023 were 19,837 carriers, resulting in a net reduction of 4.302 carriers.
- This is the fourth consecutive quarter with net reduction in capacity.
- Class 8 truck net orders in Q3 2023 reported negative 18.6% YoY growth.
- Growth in retail sales for CL8 went down for the eighth consecutive month.
- Employment in long-distance trucking continued to decline for the third month in a row.
- Turned negative YoY for the first time since Mar. 2021.
Beon Band vs Economic Demand Indicators: % YoY Change by Quarter
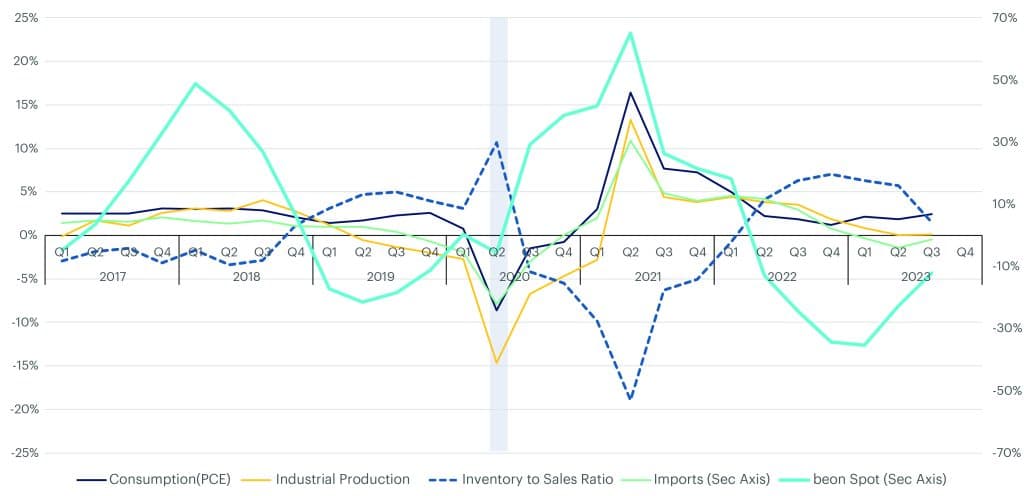
Source: Bureau of Economic Analysis (BEA), Federal Reserve, Census Bureau, Bureau of Labor Statistics, Beon Band – Transportation Insight Holdings
Beon Band vs Freight Demand (CASS Freight Index): %YoY Change by Quarter
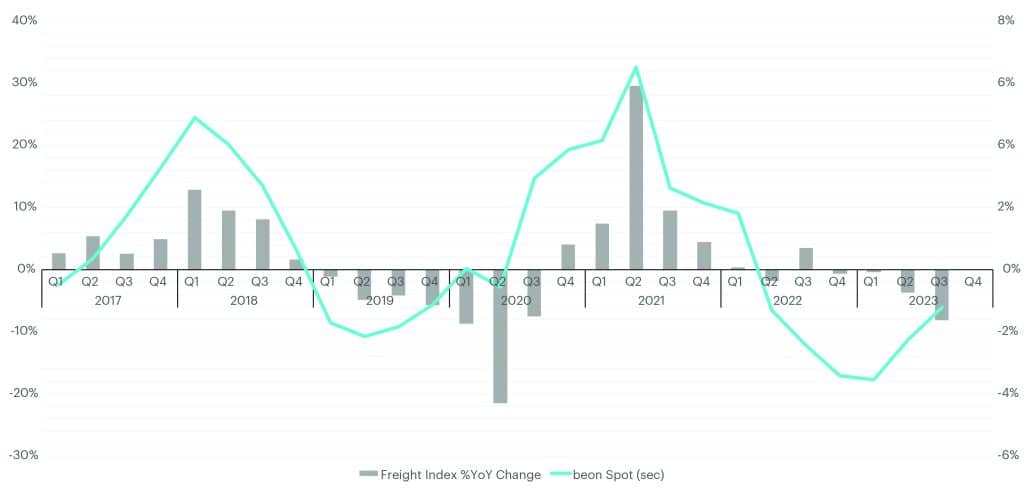
Source: Cass Freight Index, Beon Band – Transportation Insight Holdings About Author:


On this article:
Sign up for the TI newsletter to get exclusive updates.