
- Solutions
Back to Knowledge Center
Q2 2023 Transportation Outlook
Prepare now or lose later Table of Contents: The wait continues from Q1 into Q2 2023 for any meaningful pickup in imports as shippers work down existing inventory levels and U.S. manufacturing activity contracts. Inflation is slowly easing and while retail sales show that they decreased 1% from February into March 2023, they are, in […]
May 8, 2023 — 12 Min Read

Prepare now or lose later
Table of Contents:
- TL Market Fundamentals
- Checking the Record
- Key Learnings
- Core Metrics
- Rate Forecast
- Port to Porch Market Forecast
The wait continues from Q1 into Q2 2023 for any meaningful pickup in imports as shippers work down existing inventory levels and U.S. manufacturing activity contracts. Inflation is slowly easing and while retail sales show that they decreased 1% from February into March 2023, they are, in fact, still up 3.1% YoY, when we exclude sales at gasoline stations.
On the capacity front, carriers are struggling with the slowdown in demand, increased competition on available freight and spot rates that remain bottomed out since Q1 2023. On the upside, market indicators are pointing to a stronger second half of the year.
Let’s all remember, our freight industry is very cyclical. We believe we are at the bottom now, but when will the market turn?
If shippers are not focused on contingency planning for Q4 2023 and early 2024, they will run the risk of higher costs, lower service quality and inevitable delivery delays later in the year. In this outlook, we will give you the data and perspective needed to navigate the current quarter and plan for the back half of 2023 and early 2024.
TL Market Fundamentals
Rates will continue to be in shippers’ favor through Q2 2023, but now is not the time to sit back. It’s time to work in tandem with your 3PL and carrier partners to discuss and plan for the second half of the year.
- Shippers expect slower sales for the first half of 2023. They will be more cautious in replenishing inventories as they continue to wind down last year’s inventory surplus, which was the highest YoY comparison at +11.4% in Q3 2022.
- Consumers are still spending as inflation remains high, up 5.0% YoY at the end of Q1 2023. As consumers are more careful with their spending, and larger portions of consumers’ paychecks are going toward essentials such as food, consumers continue to prioritize service purchases over goods purchases.
- Retail sales ended Q1 2023 down 1.0% from February into March, however yearly comparisons place retail sales up nearly 3% YoY. Many consumers are utilizing credit to continue their spending habits, returning credit card debt to record-high levels which are currently up 16.5% above February 2022 levels. Interest rates are also not helping the consumers, placing even more of a burden on those with high credit card debt. As a result, there is a growing concern that consumers will be unable to maintain the same level of consumer spending in the second half of 2023.
Analysis 360 | Checking the Record
What we got right in our previous outlook.
Q1 2023 contract rates are dipping into deflationary territory YoY and will likely remain deflationary throughout 2023 and into Q1 2024.
- The contract TL market for Q4 2022 ended at +1.8%. We expected this contract curve to enter the deflationary cycle in Q1 2023 at -2.5% YoY and continue to stay deflationary for the entirety of 2023.
Where we were off the mark, and why:
Rates will continue to trend downwards, reaching the bottom by the end of Q1 2023 when operating costs outweigh profit, causing more carriers to exit the market. Starting around Q2 2023, expect a sharper than usual bounce back from the bottom of the cycle in reaction to the rapid drop in prior quarters.
- The Beon™ Band* for Q4 2022 ended at -34.9% due to weaker-than-expected peak demand. We believed Q4 was going to be the bottom of the freight rate cycle, and from there we expected our journey upward to equilibrium, and crossing the x-axis in Q3 2023
- As a result of capacity hanging around longer than anticipated despite the low spot rates, in addition to the low demand, the bottom of the freight cycle occurred in Q1 2023 at -35.4%.
Key Learnings
With supply surpassing demand, shippers must take advantage of this time to prepare contingency plans for unknown risks through the end of 2023.
- As a result of decreased demand and an oversaturated carrier market, as of May 2023 spot rates are currently at -26.8% YoY and have just started their journey upward, yet inflation remains well above the Fed’s target of 2%. To succeed in this environment, it is crucial to have visibility into internal and external datasets and conduct proper planning for when the market approaches inflationary territory.
- The spikes in the market are becoming more dramatic since the pandemic, with the last bottom of the cycle around -20% YoY versus 2023 at -35.5%. Carriers have floors to their pricing relative to their operating costs, typically in the $1.65 to $1.70 CPM range (excl. fuel), which means we can normally anticipate when supply will have to exit. However, because of the decreasing fuel costs and lack of opportunity to switch to another craft, drivers are holding out longer this time around.
- For any material change in spot rates to occur, there needs to be a capacity dislocation event, or catalyst. The question remains, will it be increased demand or capacity attrition? As it stands right now, it appears that demand will only get a modest gain from Produce Season, thus the catalyst will most likely be enough attrition of capacity to cause a steeper increase in spot rates. With net revocations of Carrier Authority running above 7,000 per month since October, we’re seeing capacity exit. We believe this trend will continue throughout this quarter and into next.
Here are our top 3 tips for shippers when preparing for the second half of 2023:
- Live up to your commitments. Once a lane is converted to contractual, honor that volume commitment if meeting service requirements and avoid the temptation of a slightly better spot price. While spot is attractive at the current rates, you will open yourself up to more risk onboarding a poor service provider taking advantage of current market conditions.
- Move as much volume as possible from the spot market to the contractual market over the next 3 months. When doing this, focus on your higher volume lanes (over 52 loads per year) or on higher volume markets where you could find competitive contractual rates.
- Benchmark carrier service metrics, such as tender acceptance % and on-time pickup/delivery, so you can hold them accountable to the same performance levels in the second half of 2023 and beyond. This is crucial as we head into 2024 with rates expected to be in the carrier’s favor again.

“Q2 2023 is not a period to sit on your hands. Instead, it’s time to work in tandem with your 3PL and carrier partners to discuss what the second half of the year will look like and plan accordingly. We all know rate volatility is real…and it’s about to get even more real when the market does flip. Don’t wait to act until it’s too late.”
– Drew Herpich, Chief Commercial Officer
If you have questions or would like to talk to Drew Herpich, Chief Commercial Officer and Amit Prasad, Chief Data Science Officer then please reach out to them directly at [email protected]

Core Metrics
Key Economic Indicators : The Cause (% YoY Change by Quarter)
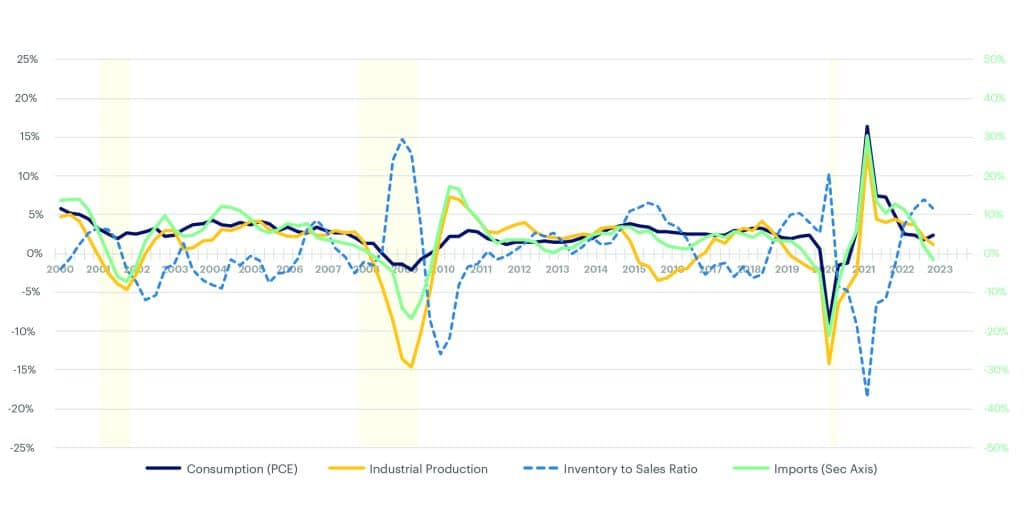
- Preliminary readings for the Personal Consumption Expenditures (PCE) for Q1 2023 show a +2.3% YoY, which is stronger than expected. This marks the first improvement in consumption after six quarters of sequential decline.
- Durable goods consumption bounced back to +2.7% YoY. Non-durable goods also changed relatively high to -0.3% YoY.
- Services held flat at +3.0% YoY. This shows a shift in consumption dollars from goods to services sector.
- The PCE Price Index shows the prices for service stayed inflated in Q1 while for the durable and non-durable goods cooled down.
- Industrial Production (IP) went down to +1.0% in Q1 2023 as expected. Manufacturing output decreased 0.5% in March and was 1.1% below its year-earlier level.
- Inventory-to-sales ratio decreased to +5.7% in Q1 2023, which is in line with PCE readings.
- Inflation numbers show further signs of cooling.
- CPI Inflation for March 2023 came down to 5% month-to-month, but inflation is still positive at +0.1%.
- Imports were on course-correction much of last year.
- Imports went further down to -2% YoY in Q1 2023.
- Changes up or down in imports influence the freight demand since the raw material, intermediary or finished products imported from outside will likely ship at some point on a truck to reach its destination.
- Like IP, imports down below the X-axis in the past have coincided with an economic recession.
- Imports went further down to -2% YoY in Q1 2023.
According to Wolfe Research’s Q1 2023 shippers’ survey, about 41% of shippers cited higher year-over-year inventory levels. Despite progress in reducing inventories, 55% of shippers noted that their inventory levels are still above targeted levels, the highest level in 11 quarters. Thus, inventory de-stocking headwinds to freight volumes seem likely to continue in Q2 2023.
TL Spot & Contract Cost Curve (% YoY Change by Quarter)
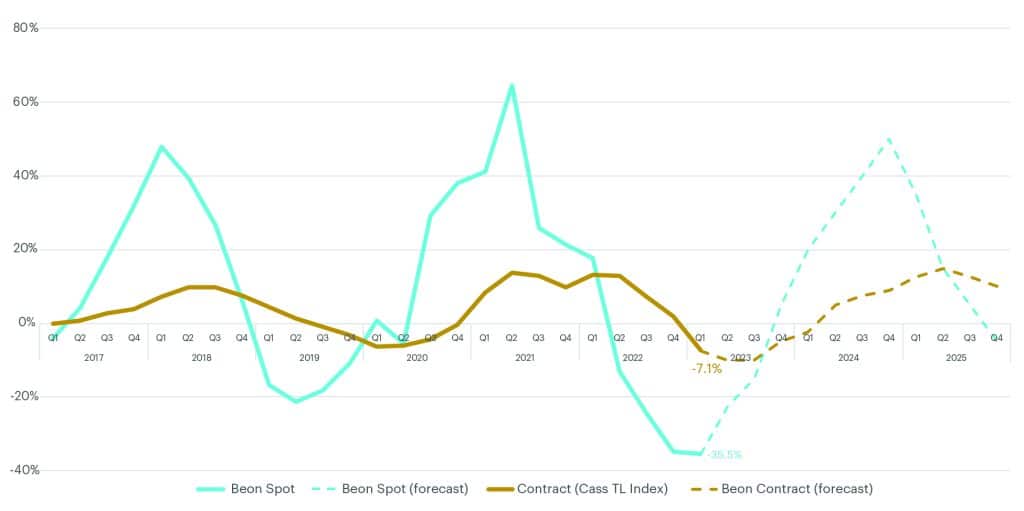
What is Beon™ Band?
The Beon™ Band rolls up YoY quarterly averages of this data to create trend lines. This band is the outcome of the relationship between freight supply and freight demand, with freight demand being driven by the macroeconomic demand indicators. When we overlay the Beon™ Band with the demand curve in a single chart, we can see demand’s influence on the to-the-truck costs.
Rate Forecast
- TL spot & contract with Beon™ Band
- Spot: Lower-than-projected freight demand due to softer economy and plummeted imports in Q1 2023 took the Beon Band further down to -35.5%, making it the new bottom of the deflationary leg. We project that the curve will now move upwards towards the equilibrium from here with Q2 2023 around -22.5% and turn inflationary crossing the abscissa in the 2nd half of Q4 2023. We expect that it will stay inflationary for the entirety of 2024 reaching the peak of inflation in Q4 2024.
- Contract: The TL contract cycle (represented by change in CASS TL Index) shows the contract TL cycle finally entered the deflationary leg in Q1 2023 at -7.1% YoY, close to our forecast of -7.5%. We expect the contract cycle to go further deflationary in Q2 and Q3 2023. It will likely start heading towards equilibrium in Q4 2023 and should cross the X-axis in Q2 of 2024. Contract cycle lags spot cycle by 2-3 quarters.

“As shippers navigate the deflationary market, this is the time to strengthen relationships with loyal carriers. As the supply further exits, the spot market is going to tighten towards the year-end and into 2024, and the tender rejections are going to increase. Building a long-term transportation and procurement strategy is going to help navigate through the inflationary leg of the cycle.”
–Amit Prasad, Chief Data Science Officer
Port to Porch Market Forecast
Drayage
Lackluster imports will continue through this quarter as shippers focus on shipment accuracy and carriers adjust to volume challenges.
- Shipper KPIs drastically shifted compared to Q2 2022, when the main concern was available capacity and tender acceptance. As of late, shippers are less focused on capacity and more focused on invoicing speed, accuracy, carrier accessorial scrutiny and visibility.
- Labor tensions on the West Coast are steering shippers to the East and Gulf Coasts, such as NY/NJ, Savannah, and Houston. Descartes Systems Group recently claimed that over 1 million TEUs per year have shifted away from West Coast ports because of the labor tensions and service concerns.
- Total U.S. Port TEUs are down YoY, but we have seen a 6.9% increase in volume from February into March 2023.
- Two points of considerations:
- March 2023 had 3 more shipping days than February 2023.
- Chinese New Year started in January 2023 and could have caused import carryover into March 2023.
- Two points of considerations:
LTL
This quarter, shippers need to re-evaluate their carrier usage as carriers’ pricing discipline has allowed rates to hold above standard.
- Many shippers still think LTL carriers should be dropping prices to gain more volume. The reality is some carriers are making small adjustments in order to prioritize more attractive freight (standard-size pallets, business-to-business).
- Shippers need to work closely with key incumbents during rate negotiations and service-level reviews to create win-win results.
- Explore volume quotes for larger shipments. Most carriers are providing re-quotes in the majority of lanes again.
Parcel
Rate increases are no longer sustainable; now is the time to be more open to negotiating and diversifying the carrier base as capacity softens.
- The average rate increase for FedEx and UPS was 6.9% compared to 5.9% in 2022.
- UPS Teamster contract expires July 31, 2023, as national negotiations began in April 2023.
- Shippers are moving volumes away from UPS to mitigate the risk of a potential strike.
- Startups and regional carriers doubled their collective package volume in 2021 and witnessed an additional 25% growth in 2022, according to the Pitney Bowes Parcel Shipping Index.
Cross-Border
Demand for cross-border services between U.S. and Mexico remains strong for the second quarter of 2023 as U.S. and Canada volumes remain low.
Canada
- February freight volume between the U.S. and Canada is up 5.5% YoY. The truckload freight is valued at $32.8bn, according to the Bureau of Transportation Statistics.
- Capacity outbound from Canada, especially out of major metros, remains very strong and up more than 4% YoY according to Census data.
- Carriers are looking for consistent opportunities to get them on the U.S. side of the border because of the relatively stronger demand for U.S. imports into Canada.
Mexico
- February freight volume between the U.S. and Mexico is up 7.8% YoY. The truckload freight is valued at $43.1bn, according to the Bureau of Transportation Statistics.
- Trade between the U.S. and Mexico continues to grow, increasing by 10% in the first two months of 2023 compared to the same period in 2022.
- Mexico was ranked number 1 among U.S. trade partners during the first two months of 2023, showing demand for cross-border transportation services will continue on both sides of the border.
If you have questions or would like to talk to Drew Herpich, Chief Commercial Officer and Amit Prasad, Chief Data Science Officer then please reach out to them directly at [email protected]
About Author:
More Blogs


On this article:
Sign up for the TI newsletter to get exclusive updates.